
|
|
1.IntroductionMultiple sclerosis (MS) is a chronic inflammatory neurological disease that results in loss of both myelin and axons.1 In particular, the corpus callosum is known to undergo considerable damage during the progression of MS.2,3 Such damage could greatly reduce the functional communication between the hemispheres. Indeed, studies using functional magnetic resonance imaging (fMRI) have demonstrated disrupted inter-regional communication throughout a number of brain networks in MS patients.4,5 Reduction in functional communication may, thus, be a quantifiable indicator of MS progression and response to treatments aimed at reducing demyelination, stimulating remyelination, and restoring brain function in MS. However, fMRI does not lend itself to a quick and easy bedside assessment of inter-regional communication, which is desirable for clinical application and for repeated assessments of treatment response, especially over a short period of observation. Brain activity increases oxyhemoglobin concentration (HbO) and total hemoglobin concentration (HbT), and reduces deoxyhemoglobin concentration (HbR) due to increased perfusion.6,7 Changes in these parameters are easily measurable using functional near-infrared spectroscopy (fNIRS), which is a noninvasive and portable method that monitors brain oxygenation by detecting the attenuation of light by HbO and HbR at two separate wavelengths.8 We and others have recently demonstrated the successful use of fNIRS in the detection of interhemispheric communication between the motor cortices of healthy control subjects by examining the coherence of brain signals in the frequency domain.9,10 Coherence quantifies the similarity between signals originating from different brain regions (and, hence, the strength of the functional connection) by comparing the magnitude of specific frequency components.11 In this study, we used fNIRS to determine the coherence between the left and right motor cortices during task execution and rest, in MS patients and healthy controls. We hypothesized that coherence would be reduced in MS patients compared to healthy participants due to reduced interhemispheric communication. In addition, MS patients recruit more brain centers during task activation.12,13 This additional recruitment may also reduce coherence, so we measured during resting state as well as during task activation. If this hypothesis was proven, fNIRS measures of coherence could potentially be a noninvasive indicator of axonal damage and demyelination. 2.Methods2.1.SubjectsThis study was approved by the Conjoint Health Research Ethics Board of the University of Calgary. Eight MS patients (four male, four female; age years) and eight healthy control participants (six male, two female; age years, ) were recruited. One control subject was excluded from analysis due to poor contact between the source detectors and the scalp. The MS patient group was recruited from the Calgary MS Clinic and consisted of four relapsing remitting MS, two secondary progressive MS, one clinically isolated syndrome, and one MS patient whose diagnosis was unconfirmed. All subjects were right-handed, although this was not a selection criterion. No MS patients were using cannabinoids at the time of study, but use of disease-modifying therapies was permitted. 2.2.fNIRS SystemfNIRS was collected using a continuous wave system (CW5; TechEn Inc., Milford, Massachusetts) that transmits light at 690 and 830 nm using laser diode sources and detects light using avalanche photodiode detectors. Transmitted light is frequency encoded and modulated in 200-Hz steps in the range of 6.4 to 12.6 kHz. This permits identification and simultaneous detection of each unique source-detector pair. Each source-detector pair can be identified through Fourier transformation via CW5 software. Eight independent light sources and sixteen optical detectors were used. Fiber optics was used to connect the light to a custom-built head cap. The head cap was positioned such that the posterior light sources were placed at 40% of the distance along the midline between the top of the nasal cartilage and the end of the occipital bone. The row of source detectors extended down each side, with the lowest detector being positioned just above the ear. Based on the electroencephalography coordinate system as described previously,10,14 this covers the motor cortex. The probe was affixed to the head using a Velcro strap. Source-detector pair separation was , providing a head coverage of . The array was covered with black cotton cloth to block extraneous light. 2.3.Imaging ProtocolParticipants sat in a comfortable chair in a darkened room. fNIRS data were first collected for 300 s while participants rested. Data were then collected while subjects performed a finger tapping paradigm using their right hand, where the index and middle fingers were simultaneously touched with the thumb at a rate of 1 Hz, as timed by an audio metronome. It is unlikely that this signal from the auditory cortex can be detected using this experimental setup, as the light sources-detectors do not extend that far down the head. The complete paradigm consisted of 30 s of rest followed by six alternating periods of 15 s of tapping and 30 s of rest (without any sound), for a total time of 300 s. As the motor function is in the right hand, we expect the predominant activation to be in the left motor cortex. 2.4.Data Processing and AnalysisHemodynamic evoked response software (Center for Functional Neuroimaging Technologies, Charlestown, Massachusetts)15 was used to process the fNIRS data. Physiological noise was first removed using a low-pass filter of 0.8 Hz. Concentrations of HbO, HbR, and HbT were then calculated for each source-detector pair combination. Changes in the concentration of HbO and HbT as a result of each finger tapping block were calculated for each source-detector pair by subtracting the average of the middle 7.5 s of the baseline periods prior to and after a tapping block from the average of the last 10 s of the finger tapping block. A univariate two-factor analysis of variance (ANOVA) was used to compare the HbT and HbO concentration changes for the source-detection pair that exhibited the greatest change, with block (1 through 6) and subject group (patient, control). The source-detector pair that exhibited the greatest change in HbO during finger tapping was assumed to be the location of the motor cortex and was subsequently used as the location (or seed) for comparison with all other pairs during coherence analysis. In our subjects, this source-detector pair also showed the greatest change in HbT. Coherence maps for each of HbO and HbT, for each of the subjects at rest and finger tapping, were then generated using a custom MATLAB® program, over the frequency band of 0.02 to 0.04 Hz as described previously.10 In the hemisphere ipsilateral to the seed, coherence was averaged over the three source-detector pairs surrounding the seed (the seed was not included, as coherence is 1 by definition). In the contralateral hemisphere, coherence was averaged over the four source-detector pairs at the homologous locations. Coherence values from all participants were tested as a group for normality using the Shapiro-Wilk normality test and by creating Q-Q plots. Upon confirming normality, univariate ANOVAs were conducted for each of HbO or HbT coherence, with subject group (patient, control) and hemisphere (ipsilateral, contralateral) as factors. Follow-up tests were used to further compare subgroups. 3.ResultsANOVAs revealed no effect of the task block (i.e., there was no difference between the six rest/tapping tasks) on the change in HbT or HbO concentration [; ]. There was, however, an effect of subject group, with MS subjects exhibiting a smaller change in concentration of HbT [;] and HbO [; ] during finger tapping, compared to controls (Fig. 1). Fig. 1Changes in HbO and HbT concentrations in the left motor cortex during finger tapping. Control subjects exhibit significantly greater changes in HbO and HbT concentrations compared to multiple sclerosis (MS) patients (; controls, 8 patients; **).  Figure 2(a) shows a representative HbT coherence map calculated from data collected during finger tapping in a healthy control subject, demonstrating high coherence in both the left and right motor cortices. Figure 2(b) shows a representative HbT coherence map during finger tapping for an MS patient, demonstrating reduced coherence relative to the control subject. Fig. 2HbT coherence maps during finger tapping for a representative (a) control subject and (b) MS patient. White arrows indicate the location of the source-detector pair that was selected as the seed signal. 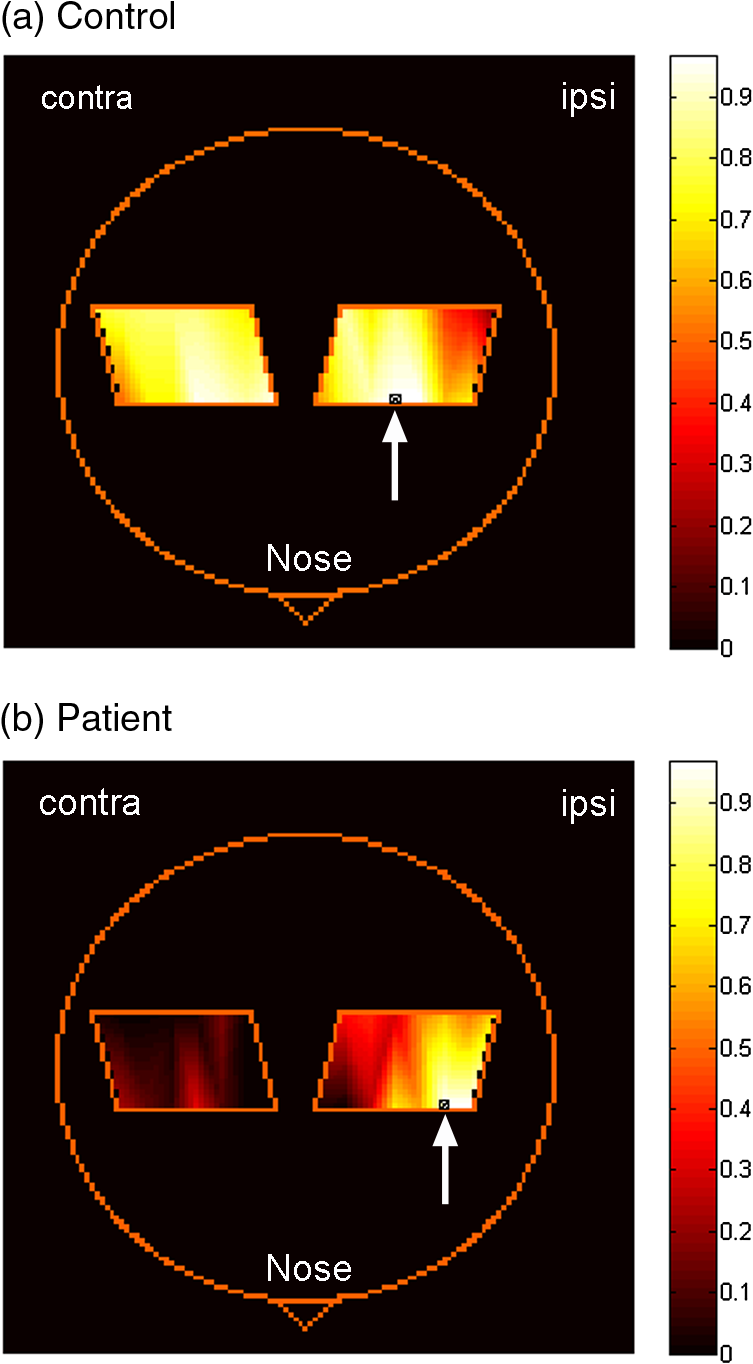 Finger tapping resulted in a significant increase in HbT coherence in controls in both the ipsilateral, as well as the contralateral side [; ], but not in patients with MS. There was a significant difference in HbT coherence during finger tapping between patients and control subjects [; ]. Follow-up tests revealed that HbT coherence in the contralateral hemisphere was significantly reduced in MS patients compared to controls [, )] (Fig. 3). There is a significant difference in coherence between the ipsilateral and contralateral hemispheres relative to the seed in both controls and MS patients [; ] (Fig. 3). There were no interactions between the subject group and the hemisphere [; ]. Interestingly, there were no significant differences in resting-state coherence between MS and controls. There were also no significant differences in HbO coherence between groups or hemispheres, for finger tapping and the resting state. 4.DiscussionThe fNIRS data show increased HbO and HbT concentrations for all participants in response to finger tapping. However, the magnitude of oxygenation changes in response to task execution was reduced in MS patients (i.e., less increase in HbT or HbO) compared to controls. Studies using blood oxygen level dependent MRI have shown that MS patients may have a larger volume of activation compared to controls for a given task,16 and more brain centers are recruited.12,13 Since more brain centers are needed for a particular task, it is possible that an individual region has a reduced magnitude of activation, which would explain the smaller changes in HbT and HbO. The use of coherence analysis has been applied previously to fNIRS data to study regional connectivity.9,10 Using a frequency band similar to that in the current study, these groups reported a mean interhemispheric coherence during the resting states of 0.6 and 0.5, respectively, which is similar to that of 0.53 reported in this paper. This repeatability supports the concept that fNIRS is a reliable method for studying functional connectivity in the cortex. There was no significant difference in contralateral coherence between controls and MS patients during the resting state. fMRI data have been used to report both higher and lower coherence in the motor cortex during the resting state when comparing MS to controls.5,17–19 Resolution of these differences will need additional studies. Finger tapping significantly increased HbT coherence in both ipsilateral and contralateral hemispheres of control subjects. However, MS patients did not show significant changes in HbT coherence during finger tapping. The relative increase in coherence in controls during task activation resulted in a significant difference in coherence in the contralateral hemisphere between controls and MS patients during the task. Although we do not have a clear mechanism at this time, there is clearly a change in how coherence is regulated that relates to the presence of task activation. This is in agreement with previous fMRI studies, which found that increased functional connectivity occurred during task activation.20,21 Reduced coherence could be the result of reduced axonal integrity,2 atrophy of the corpus callosum, 22,23 or increased demyelination.24,25 Interhemispheric HbO coherence, on the other hand, was not significantly different between MS patients and healthy controls. One possible reason for this discrepancy could be that HbT is less susceptible to contamination signals from pial vessels26 and, hence, is a better indicator of functional communication between brain regions. In fNIRS, there is a partial volume effect in that light passes though tissue other than brain. There may also be extracerebral signals, such as pial vessels and blood in the skull that will contaminate the signal.26 This would mean that brain atrophy may influence the results if there is a change in distance from the optical fibers to the brain. It is known that brain atrophy is common in MS patients.27,28 MS patients with a long disease duration have cortical thinning,29 which could increase the distance between the skull and the brain. The reduced magnitude of HbT and HbO responses in MS patients could, in part, be explained if there was an increased distance from the fibers to the brain. However, half of the MS patients included in this study were relapsing-remitting patients, who typically have less brain atrophy compared to progressive MS patients.30 An advantage of coherence analysis is that these partial volume problems would not be expected to impact the frequency responses. In conclusion, we showed that fNIRS measurements of coherence may be useful in detecting functional changes in MS patients. The overlap between the results of patients and controls would suggest that it would be difficult to identify a single MS patient. However, improvements in data collection and analysis may provide useful additional power with respect to making such a discrimination. For instance, cognitive impairments occur frequently in patients with MS, suggesting alterations in the prefrontal cortex.31 Therefore, choosing another region other than the motor cortex may be useful in identifying patients on an individual basis. As we hypothesize that the reduction in coherence is a result of impaired communication following white matter degeneration and axonal loss, it follows that this study paradigm may also be useful for any condition with such a degeneration. This technique could then be applied to disorders such as mild traumatic brain injury32 and schizophrenia.33 Coherence analysis using fNIRS is a promising technique in brain research and clinical practice. AcknowledgmentsThis research was supported by the Multiple Sclerosis Society of Canada, the Alberta endMS Regional Research and Training Centre of the endMS Research and Training Network, the National Science and Engineering Research Council of Canada, Alberta Innovates-Health Solutions, and the Undergraduate Student Research Program at the University of Calgary. ReferencesS. K. Ludwin,
“The pathogenesis of multiple sclerosis: relating human pathology to experimental studies,”
J. Neuropathol. Exp. Neurol., 65
(4), 305
–318
(2006). http://dx.doi.org/10.1097/01.jnen.0000225024.12074.80 JNENAD 0022-3069 Google Scholar
N. Evangelouet al.,
“Regional axonal loss in the corpus callosum correlates with cerebral white matter lesion volume and distribution in multiple sclerosis,”
Brain, 123
(9), 1845
–1849
(2000). http://dx.doi.org/10.1093/brain/123.9.1845 BRAIAK 0006-8950 Google Scholar
A. D. Gean-Martonet al.,
“Abnormal corpus callosum: a sensitive and specific indicator of multiple sclerosis,”
Radiology, 180
(1), 215
–221
(1991). RADLAX 0033-8419 Google Scholar
B. Basileet al.,
“Functional connectivity changes within specific networks parallel the clinical evolution of multiple sclerosis,”
Mult. Scler., 20
(8), 1050
–1057
(2013). Google Scholar
M. A. Roccaet al.,
“Large-scale neuronal network dysfunction in relapsing-remitting multiple sclerosis,”
Neurology, 79
(14), 1449
–1457
(2012). http://dx.doi.org/10.1212/WNL.0b013e31826d5f10 NEURAI 0028-3878 Google Scholar
R. B. BuxtonE. C. WongL. R. Frank,
“Dynamics of blood flow and oxygenation changes during brain activation: the balloon model,”
Magn. Reson. Med., 39
(6), 855
–864
(1998). http://dx.doi.org/10.1002/(ISSN)1522-2594 MRMEEN 0740-3194 Google Scholar
I. KidaD. L. RothmanF. Hyder,
“Dynamics of changes in blood flow, volume, and oxygenation: implications for dynamic functional magnetic resonance imaging calibration,”
J. Cereb. Blood Flow Metab., 27
(4), 690
–696
(2007). JCBMDN 0271-678X Google Scholar
T. J. Huppertet al.,
“A temporal comparison of BOLD, ASL, and NIRS hemodynamic responses to motor stimuli in adult humans,”
Neuroimage, 29
(2), 368
–382
(2006). http://dx.doi.org/10.1016/j.neuroimage.2005.08.065 NEIMEF 1053-8119 Google Scholar
S. Sasaiet al.,
“Frequency-specific functional connectivity in the brain during resting state revealed by NIRS,”
Neuroimage, 56
(1), 252
–257
(2011). http://dx.doi.org/10.1016/j.neuroimage.2010.12.075 NEIMEF 1053-8119 Google Scholar
V. Varshneyet al.,
“Detection of inter-hemispheric functional connectivity in motor cortex with coherence analysis,”
J. Eur. Opt. Soc., 7 12047
(2012). http://dx.doi.org/10.2971/jeos.2012.12047 1990-2573 Google Scholar
F. T. SunL. M. MillerM. D'Esposito,
“Measuring interregional functional connectivity using coherence and partial coherence analyses of fMRI data,”
Neuroimage, 21
(2), 647
–658
(2004). http://dx.doi.org/10.1016/j.neuroimage.2003.09.056 NEIMEF 1053-8119 Google Scholar
M. Leeet al.,
“The motor cortex shows adaptive functional changes to brain injury from multiple sclerosis,”
Ann. Neurol., 47
(5), 606
–613
(2000). http://dx.doi.org/10.1002/(ISSN)1531-8249 ANNED3 0364-5134 Google Scholar
M. A. Roccaet al.,
“Adaptive functional changes in the cerebral cortex of patients with nondisabling multiple sclerosis correlate with the extent of brain structural damage,”
Ann. Neurol., 51
(3), 330
–339
(2002). http://dx.doi.org/10.1002/(ISSN)1531-8249 ANNED3 0364-5134 Google Scholar
M. A. Franceschiniet al.,
“Hemodynamic evoked response of the sensorimotor cortex measured noninvasively with near-infrared optical imaging,”
Psychophysiology, 40
(4), 548
–560
(2003). http://dx.doi.org/10.1111/psyp.2003.40.issue-4 PSPHAF 0048-5772 Google Scholar
T. J. Huppertet al.,
“HomER: a review of time-series analysis methods for near-infrared spectroscopy of the brain,”
Appl. Opt., 48
(10), D280
–298
(2009). http://dx.doi.org/10.1364/AO.48.00D280 APOPAI 0003-6935 Google Scholar
M. Filippiet al.,
“Functional magnetic resonance imaging correlates of fatigue in multiple sclerosis,”
Neuroimage, 15
(3), 559
–567
(2002). http://dx.doi.org/10.1006/nimg.2001.1011 NEIMEF 1053-8119 Google Scholar
P. Valsasinaet al.,
“A multicentre study of motor functional connectivity changes in patients with multiple sclerosis,”
Eur. J. Neurosci., 33
(7), 1256
–1263
(2011). http://dx.doi.org/10.1111/ejn.2011.33.issue-7 EJONEI 0953-816X Google Scholar
M. Wojtowiczet al.,
“Altered functional connectivity and performance variability in relapsing-remitting multiple sclerosis,”
Mult. Scler.,
(2014). Google Scholar
G. Zitoet al.,
“Inter-hemispheric functional connectivity changes with corpus callosum morphology in multiple sclerosis,”
Neuroscience, 266 47
–55
(2014). http://dx.doi.org/10.1016/j.neuroscience.2014.01.039 0306-4522 Google Scholar
A. T. NewtonV. L. MorganJ. C. Gore,
“Task demand modulation of steady-state functional connectivity to primary motor cortex,”
Hum. Brain Mapp., 28
(7), 663
–672
(2007). http://dx.doi.org/10.1002/(ISSN)1097-0193 HBRME7 1065-9471 Google Scholar
V. Riedlet al.,
“Local activity determines functional connectivity in the resting human brain: a simultaneous FDG-PET/fMRI study,”
J. Neurosci., 34
(18), 6260
–6266
(2014). http://dx.doi.org/10.1523/JNEUROSCI.0492-14.2014 JNRSDS 0270-6474 Google Scholar
J. L. Dietemannet al.,
“Multiple sclerosis and corpus callosum atrophy: relationship of MRI findings to clinical data,”
Neuroradiology, 30
(6), 478
–480
(1988). http://dx.doi.org/10.1007/BF00339686 0028-3940 Google Scholar
J. Martolaet al.,
“Progression of non-age-related callosal brain atrophy in multiple sclerosis: a 9-year longitudinal MRI study representing four decades of disease development,”
J. Neurol. Neurosurg. Psychiatry, 78
(4), 375
–380
(2007). JNNPAU 0022-3050 Google Scholar
R. O. BarnardM. Triggs,
“Corpus callosum in multiple sclerosis,”
J. Neurol. Neurosurg. Psychiatry, 37
(11), 1259
–1264
(1974). http://dx.doi.org/10.1136/jnnp.37.11.1259 JNNPAU 0022-3050 Google Scholar
J. H. Simonet al.,
“Corpus callosum and subcallosal-periventricular lesions in multiple sclerosis: detection with MR,”
Radiology, 160
(2), 363
–367
(1986). RADLAX 0033-8419 Google Scholar
L. Gagnonet al.,
“Quantification of the cortical contribution to the NIRS signal over the motor cortex using concurrent NIRS-fMRI measurements,”
Neuroimage, 59
(4), 3933
–3940
(2012). http://dx.doi.org/10.1016/j.neuroimage.2011.10.054 NEIMEF 1053-8119 Google Scholar
N. F. Kalkerset al.,
“Longitudinal brain volume measurement in multiple sclerosis: rate of brain atrophy is independent of the disease subtype,”
Arch. Neurol., 59
(10), 1572
–1576
(2002). http://dx.doi.org/10.1001/archneur.59.10.1572 0003-9942 Google Scholar
R. A. Rudicket al.,
“Use of the brain parenchymal fraction to measure whole brain atrophy in relapsing-remitting MS. Multiple Sclerosis Collaborative Research Group,”
Neurology, 53
(8), 1698
–1704
(1999). http://dx.doi.org/10.1212/WNL.53.8.1698 NEURAI 0028-3878 Google Scholar
M. Saileret al.,
“Focal thinning of the cerebral cortex in multiple sclerosis,”
Brain, 126
(8), 1734
–1744
(2003). http://dx.doi.org/10.1093/brain/awg175 BRAIAK 0006-8950 Google Scholar
E. Fisheret al.,
“Gray matter atrophy in multiple sclerosis: a longitudinal study,”
Ann. Neurol., 64
(3), 255
–265
(2008). http://dx.doi.org/10.1002/ana.v64:3 ANNED3 0364-5134 Google Scholar
J. LoveraB. Kovner,
“Cognitive impairment in multiple sclerosis,”
Curr. Neurol. Neurosci. Rep., 12
(5), 618
–627
(2012). http://dx.doi.org/10.1007/s11910-012-0294-3 CNNRBS 1528-4042 Google Scholar
B. Johnsonet al.,
“Alteration of brain default network in subacute phase of injury in concussed individuals: resting-state fMRI study,”
Neuroimage, 59
(1), 511
–518
(2012). http://dx.doi.org/10.1016/j.neuroimage.2011.07.081 NEIMEF 1053-8119 Google Scholar
R. W. CogerE. A. Serafetinides,
“Schizophrenia, corpus callosum, and interhemispheric communication: a review,”
Psychiatry Res., 34
(2), 163
–184
(1990). http://dx.doi.org/10.1016/0165-1781(90)90017-Y PSRSDR 0165-1781 Google Scholar
|


