|
|
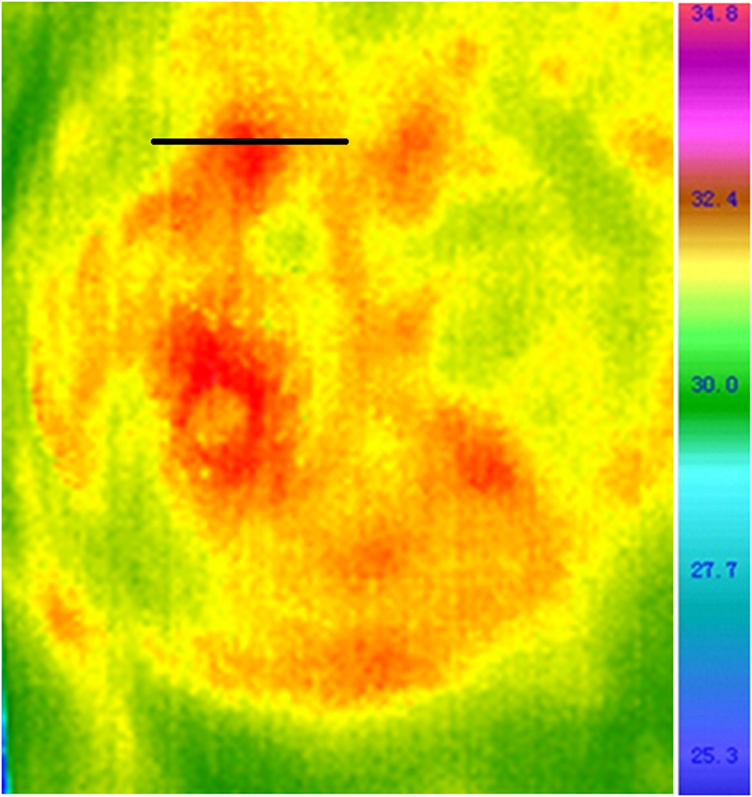
1.IntroductionThe heat and mass transfer of biological tissue is a most basic characteristic of living system.1–3 The metabolism of cells is always accompanied by the generation of heat.4–6 When the lesions occur in some part of the human body, the metabolism of cells will change to abnormal first, which means that there is strong connection between the thermal information and the pathological changes.7,8 The diseases or functional changes of a certain part of the human body will bring change to the blood flow and cell metabolism correspondingly, which makes the thermal gradient vary in this area.9–11 At the early stage of a lesion, it is difficult for the patient to perceive the temperature changes of cells, and only if the temperature of abnormal cells rises and reaches a quantitative change can the uncomfortable symptoms be perceived by the human body.10–13 In order to detect the temperature changes as early as possible, specialized medical inspection equipment has to be used.14–18 At present, the medical imaging technologies being commonly used, such as ultrasonic imaging, magnetic resonance imaging, X-computed tomography imaging etc., can display the shape changes of lesions, but cannot reflect functional changes of body tissues.19,20 When the pathological changes become structural lesions, qualitative changes have taken place in the human body.21–25 In order to acquire the valuable three-dimensional (3-D) heat distribution information based on the temperature distribution of a body surface, many researchers have carried out in-depth studies and which resulted in a series of achievements.7–24 This paper aims to acquire the curve of the heat intensity varying with the depth of tomography based on the temperature distribution characteristics of tumors in different stages. By combining 34,977 confirmed breast disease cases and the corresponding classified statistics, the diagnostic criteria of breast disease through a curve are designed.25 Six typical clinical examinations were performed to prove the validity of this novel approach, and the results of thermal tomography are compared and analyzed with those of B ultrasonic, molybdenum target (MT) x-ray and pathological examination. The examining process of this new medical diagnosis method is noninvasive, radiation-free, and fast, which suggests great application prospects in clinical medicine. 2.Principle and Methods2.1.Curve of Thermal TomographyGenerally, the Pennes equation is considered to be the most suitable one in the bioheat transfer models so far.26 It is written as where is the distribution function of the internal temperature, is the derivative of the temperature function with respect to the time variable, and are the density and thermal capacity of biological tissue, respectively, is the coefficient of heat conduction, , , and denote the perfusion, density, and thermal capacity of blood, respectively, is the temperature of arterial blood, and is the metabolic heat. In some human tissues such as female breast tissue, there are few large vessels but many small vessels or blood capillaries. Under this circumstance, we approximate the heat effect of blood perfusion to be a part of the metabolic heat. When some lesion occurs in the tissue of the human body, the abnormal heat is generated mainly by the metabolism of cells and a small part of abnormal heat is from the increase of blood perfusion. In fact, our study focuses on the analysis of heat produced in the metabolic abnormalities. Therefore, to simplify the heat-transfer model, is set as a constant, and the terms and are merged to be . Here, can be regarded as the internal heat source. In steady state (), Eq. (1) can be simplified as where is the Laplace operator and the mathematical function is introduced in Eq. (2). Here, the internal heat source term can be expressed as , in which is the intensity of the heat source, and denotes that there is a heat source at and no heat source at . So, Eq. (2) can be written asIf the diseased area is not large, or the size of the diseased area can be neglected relative to the distance from the diseased area to the body surface, or the shape of the diseased area can be approximated as a sphere though its size is relatively large, then the diseased area can be regarded as a point heat source on these occasions. The mathematical function is introduced here to simplify the form of the bioheat transfer equation and make it more feasible to solve. In order to simplify the model, , , and are set as constants, which means the heat from the point heat source in 3-D space has good spherical symmetry. Thus, in the spherical coordinate system, only the term is left in Eq. (3) can be acquired by solving Eq. (5) based on Gauss theorem:Equation (6) is used for a point source set in a free space with no boundary condition, and it is the solution of the heat transfer equation of the point heat source. Here, is the distance from the internal heat source to some point on the body surface and indicates the temperature function. In practical applications, the temperature value of various points on the body surface can be acquired with an infrared thermal detector. On the body surface, the position of point O mapped from the internal heat source can be easily found, because it is the very point where the temperature is highest. Taking the point O as the origin, a polar coordinate OX can be established as in Fig. 1, where is the depth from the internal heat source to origin O and is the distance from origin O to an arbitrary point on the body surface. In consideration of the influence of environmental temperature , the temperature distribution function of the body surface can be written as Here, is the heat intensity and is the depth of the point heat source. includes the influence of heat convective loss at the tissue–air interface in our model. This loss is proportional to the increase of the surface temperature. However, the temperature of a living human body is not possible to vary in a large range. In fact, the heat convective loss is relatively stable if the air speed on the body surface and the temperature around it can be controlled to a limited range. As can be seen from Eq. (6), the temperature distribution of the body surface can be acquired as long as the information for the internal heat source is known. However, in the practical application, the temperature of a body surface can be easily acquired with an infrared thermal detector, and the information of the internal heat source is just what we want to acquire. It is a typical inverse problem that is very difficult to be applied in clinical applications.27,28 Based on Eq. (6), we propose a novel method of thermal tomography to acquire more information about the heat intensity. In our model, the density, thermal conductivity, and thermal capacity of the biological tissue are all supposed to be constants, and the internal heat source is assumed to be an ideal point one. By setting a straight line through the point where the temperature is highest on the body surface, the temperature distribution along the straight line will fit the Lorenz curve very well.28 In the clinical application, one can set a straight line through the center of the pathological high temperature area on the infrared image (Fig. 2). Twelve points are chosen equidistantly along the straight line, and one of the points should lie in the center of the high temperature area. The temperature of every point can be extracted (Table 1). In Fig. 3, denotes the distance from the center point of the pathological high temperature area to the point chosen on the straight line and denotes the temperature of the corresponding points. The sign before the abscissa values indicates the two sides of the center point. The fitting situation is shown in Fig. 3. We use the coefficient of determination () to quantify the fitting between the Lorentz curve and temperature distribution curve. After calculation, the value of is 0.8722, which means there is a good fitting between the Lorentz curve and temperature distribution curve. Table 1Points on straight line and their corresponding temperatures.
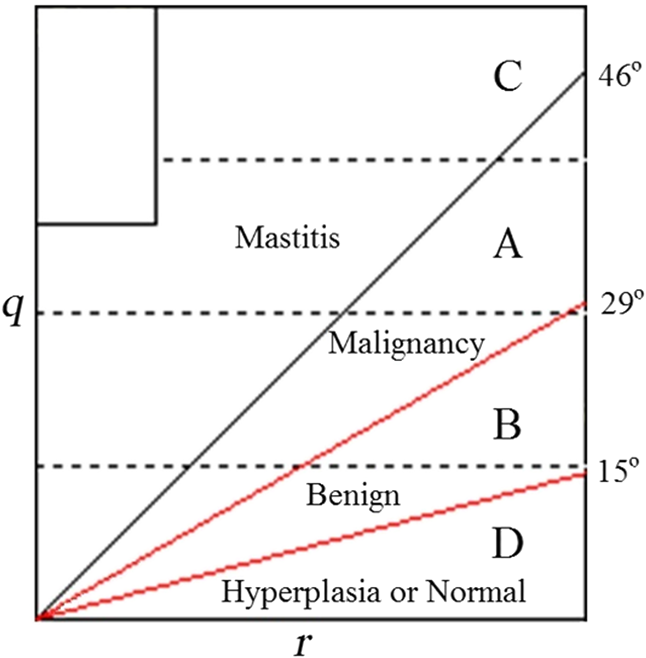
Contrasting Eq. (6) with the standard Lorentz equation , it can be determined that and , which means that the heat intensity is relative to the peak height and peak width of the temperature distribution curve.27 Taking the diseased tissue as the center of analysis, a curve can be drawn with the method of fitting the Lorentz curve. Figure 4(a) shows the curve of the diseased tissue where it can be seen that the temperature decreases gradually around the diseased tissue. Figure 4(b) shows the curve of normal tissue, from which it can be seen that there is no significant temperature difference between the chosen analysis point and the tissue around it. In Fig. 4, there are two numbers at the upper left corner, which express the coordinate values of the point chosen for analysis (The coordinate system is created in the original infrared image, the bottom left corner of the infrared image is taken as the origin, the bottom edge is taken as the abscissa axis, and the left edge is taken as the vertical axis. The coordinate values are expressed with the number of pixels). In Fig. 4(a), for instance, the analyzed point corresponds to the lateral 122nd pixel and the longitudinal 118th pixel from the bottom left corner of the original infrared image. It should be explained that the infrared images appearing in the following passage are cut out from the original ones, and are just for highlighting the diagnosed parts of the human body. Here, the coordinate values are very important for the positioning of the analyzed point. 2.2.Establishment of Diagnostic Criteria for Breast TumorTumors can be classified as malignant and benign. The benign tumor is composed of mature cells and grows slowly; the temperature difference between the body surface mapping the tumor tissue and the skin around is small, and in most instances, it is within 1°C; The malignant tumor is composed of immature cells and it grows rapidly; it has multiple blood vessels and vigorous metabolism, which leads to the obvious difference in temperature between the body surface mapping the tumor tissue and the skin around. However, in the middle and advanced stage, the liquefactive necrosis appears at the center of a malignant tumor, and it will affect the trend of the end part of the curve. The shape of the curve reflects the status of heat distribution in the human body, i.e., the status of metabolism. Our study focuses on four kinds of cases; they are malignancy, benign, mastitis and hyperplasia or normal. The key problem is how to distinguish them according to the distribution and trend of the curve. To resolve this problem, we collected 34,977 confirmed cases of breast disease and their corresponding curves from six large cooperative hospitals (People’s Hospital of Hubei province, Huaxi Hospital, General Hospital of Chinese PLA, Zhongnan Hospital, Hubei Tumor Hospital, and Hubei Hospital of Traditional Chinese Medicine). Among these confirmed cases, there were 10,566 cases of mastitis, 12,973 cases of malignant breast tumor, 9280 cases of benign breast tumor, and 2158 cases of hyperplasia of mammary glands or normal (Among the 34,977 confirmed cases of breast disease, we biopsied the tumor cases or suspected tumor cases diagnosed by imaging. If the cases can be confirmed by imaging not to be tumors, we did not do biopsy). We create a flat surface whose left border indicates the heat intensity and whose bottom border indicates the depth. All the curves must go through the origin set at the bottom left (including those of normal tissue and abnormal tissue), which means such a flat surface contains all the possibilities of the cases. The 34,977 curves were moved in this flat, and all the curves were classified with the type of disease. Different kinds of curves were indicated with different colors. Based on the distribution of curves and statistics, it was found the curves of most malignant tumors lay in section A, the curves of most benign tumors lay in section B, and the curves of most mastitides lay in section C. For most of the hyperplasia or normal cases, the curves lay in section D. The four sections were acquired with three straight lines whose included angles with the horizontal axis were 46, 29, and 15 deg (Fig. 5). (The criteria are only for female breasts at present.) The detailed statistics are shown as Table 2. The -value is an important index of measuring the reliability of statistical data. After calculation, we found the -value of our statistics is , which means our statistics are reliable. In order to get additional information, a further analysis, a posthoc test, is done to determine the difference between the two groups. In our study, multiple comparisons between the groups were performed using the Student-Newman-Keuls method. The result shows that there exists significant differences between the four groups (mastitis, malignancy, benign, and hyperplasia or normal). Table 2Distribution statistics of q−r curves.
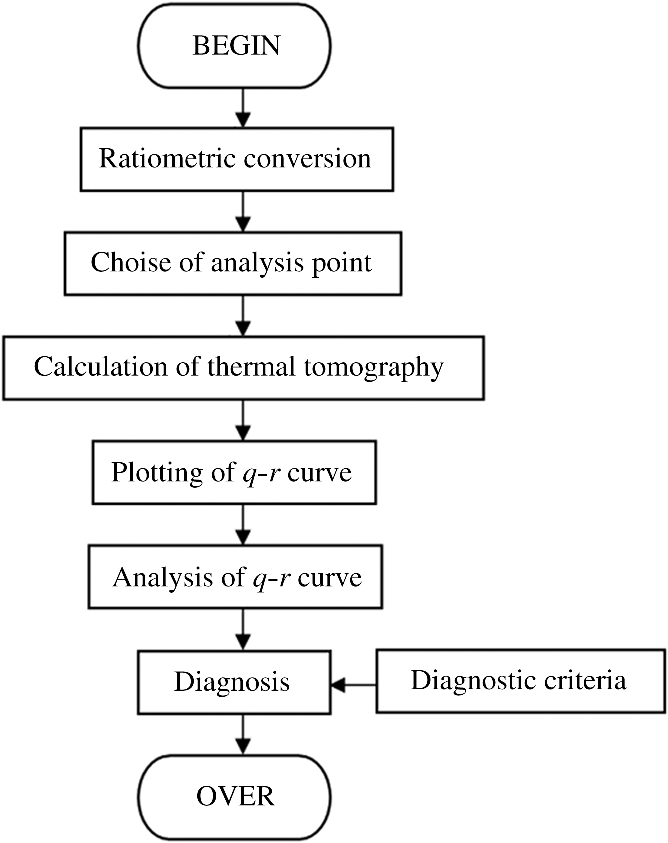
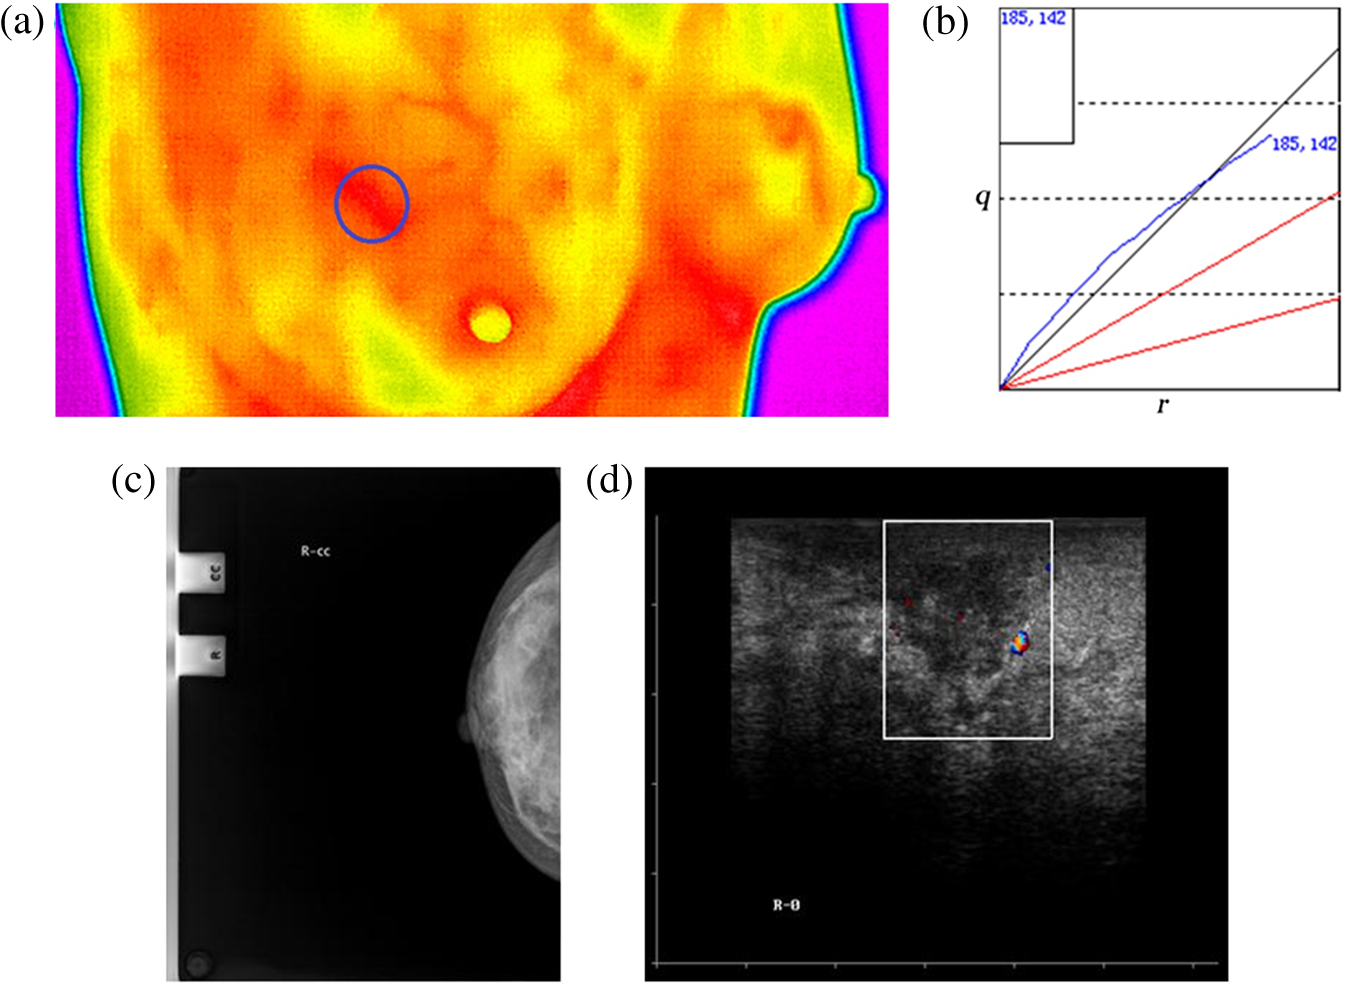
2.3.Device SchemeThe schematic diagram of the thermal tomography system is shown in Fig. 6. First, the infrared thermal detector is adopted to detect the infrared radiation of the human body and translate the thermal information into temperature information displayed with the infrared thermal image. Second, a point is chosen in the region of interest of the thermal image based on the data processing technology and the approach of thermal tomography presented in this paper, and the internal heat information curve can be acquired. Finally, according to the distribution and trend of the curve, the corresponding diagnosis can be suggested on the basis of diagnostic criteria. The highly sensitive uncooled focal plane infrared thermal imager, whose temperature resolution was 0.08°C, spatial resolution was 1.4 mrad, pixel was and focusing range was 0.5 m to , is taken as the temperature measuring tool of the human body surface. In the examination, the angle of the patient toward the camera will not affect the measured temperature of the same location on the patient. But we still demand the abnormal temperature area of patients to be facing toward the camera to acquire enough analysis area. The flow diagram of thermal tomography analysis is shown in Fig. 7. In the original infrared thermal image, we set a reference object of scale whose size is constant, and it is the basis of ratiometric conversion between the infrared thermal image and its corresponding physical object. 3.Results and AnalysisAs can be derived from the analysis above, the trend and distribution of the curve reflect the temperature field and heat distribution of the internal body tissue (i.e., the status of metabolism), which is closely related to the pathological information of the human body. For the sake of verifying the novel approach of thermal tomography tumor diagnosis and its diagnostic criteria (The diagnostic criteria are only for female breast tumor at present.), the clinical practices were performed in Galactophore Department of Hubei Tumor Hospital. In the process of the clinical practices, to reduce the flow of air the doors and windows need to be closed, and the doctors’ movements in the examining room were avoided as much as possible. The environmental temperature was 18.5°C. 3.1.Diagnosis of Malignant Breast TumorsThere were two confirmed cases of malignant breast tumor. One is diagnosed with typical malignant breast tumor that is very usual in the breast disease, such as invasive ductal carcinoma, and the other is diagnosed with atypical malignant breast tumor that is seldom seen in the breast disease such as medullary carcinoma. Woman A, whose infrared thermal image of breast was shown in Fig. 8(a), is 32 years old. There was an abnormal high temperature area on the upper left side of the left breast. A point was chosen at the selected area to do a curve analysis of thermal tomography, and the result was shown in Fig. 8(b). As could be seen from Fig. 8(b), the vast majority of the curve lay in the section of the malignancy and the heat intensity increased conspicuously with the depth of the thermal tomography. Thus, it was diagnosed as a malignant tumor by the curve analysis. Figure 8(c) was the corresponding image of the MT x-ray, from which it could be seen that there was a high density mass behind and above the left papilla, the boundary was clear and appeared invasive, and a rare calcification could be seen. Figure 8(d) was the corresponding image of the B-ultrasonic, which showed that there was a hypoechoic mass at the upper side of the left breast, the profile was irregular, the boundary was obscure, and the Doppler signals were not strong inside and around the mass. The two examinations above gave a result of malignant tumor. By pathological examination, it was diagnosed as second stage invasive ductal carcinoma, which agreed with that of the curve, MT x-ray, and B-ultrasonic. Fig. 8curve analysis of woman A and the corresponding comparison. (a) The infrared thermal image of woman A. (b) The curve analysis of woman A. (c) The image of molybdenum target (MT) x-ray of woman A. (d) The image of B-ultrasonic of woman A.  Woman B, whose infrared thermal image of breast was shown in Fig. 9(a), was 41 years old. There was an abnormal high temperature area above the right breast. A point was chosen at the selected area to do the curve analysis of thermal tomography, and the result was shown in Fig. 9(b). As could be seen from Fig. 9(b), the vast majority of the curve lay in the section of malignancy and the heat intensity increased conspicuously with the depth of thermal tomography. Thus, it was diagnosed as malignant tumor by the curve analysis. Figure 9(c) was the corresponding image of the MT x-ray, from which it could be seen that there was a mass behind the right papilla, the boundary was clear, and a rare calcification could be seen. Figure 9(d) was the corresponding image of B-ultrasonic, which showed that there was a very hypoechoic mass behind the right papilla and the echo was uniform. The profile was irregular, the boundary was obscure, and the Doppler signals were strong. The two examinations above gave the result of a malignant tumor. By pathological examination, it was diagnosed as medullary carcinoma. 3.2.Diagnosis of Benign Breast TumorsThere were two confirmed cases of benign breast tumor. One is a cystic breast tumor, and the other is a solid breast tumor. Woman C, whose infrared thermal image of breast was shown in Fig. 10(a), was 31 years old. There was an abnormal high temperature area on the upper left side of the left breast. A point was chosen at the selected area to do the curve analysis of thermal tomography, and the result was shown in Fig. 10(b). As could be seen from Fig. 10(b), the vast majority of the curve lay in the section of the benign area and the heat intensity increased with the depth of thermal tomography. Thus, it was diagnosed as benign tumor by the curve analysis. Figure 10(c) was the corresponding image of the MT x-ray, from which it could be seen that there was a low-density shadow at the posterolateral side of the left breast, the boundary was not clear, and clustered calcification could be seen. Figure 10(d) was the corresponding image of B-ultrasonic, which showed that there was a hypoechoic area at the posterolateral side of the left breast, the boundary was not clear, and at the posterior of the shadow, there was no significant change in the echo. The Doppler signals were weak. The two examinations above gave the result of benign tumor. By pathological examination, it was diagnosed as galactocele. Fig. 10curve analysis of woman C and the corresponding comparison. (a) The infrared thermal image of woman C. (b) The curve analysis of woman C. (c) The image of MT x-ray of woman C. (d) The image of B-ultrasonic of woman C. 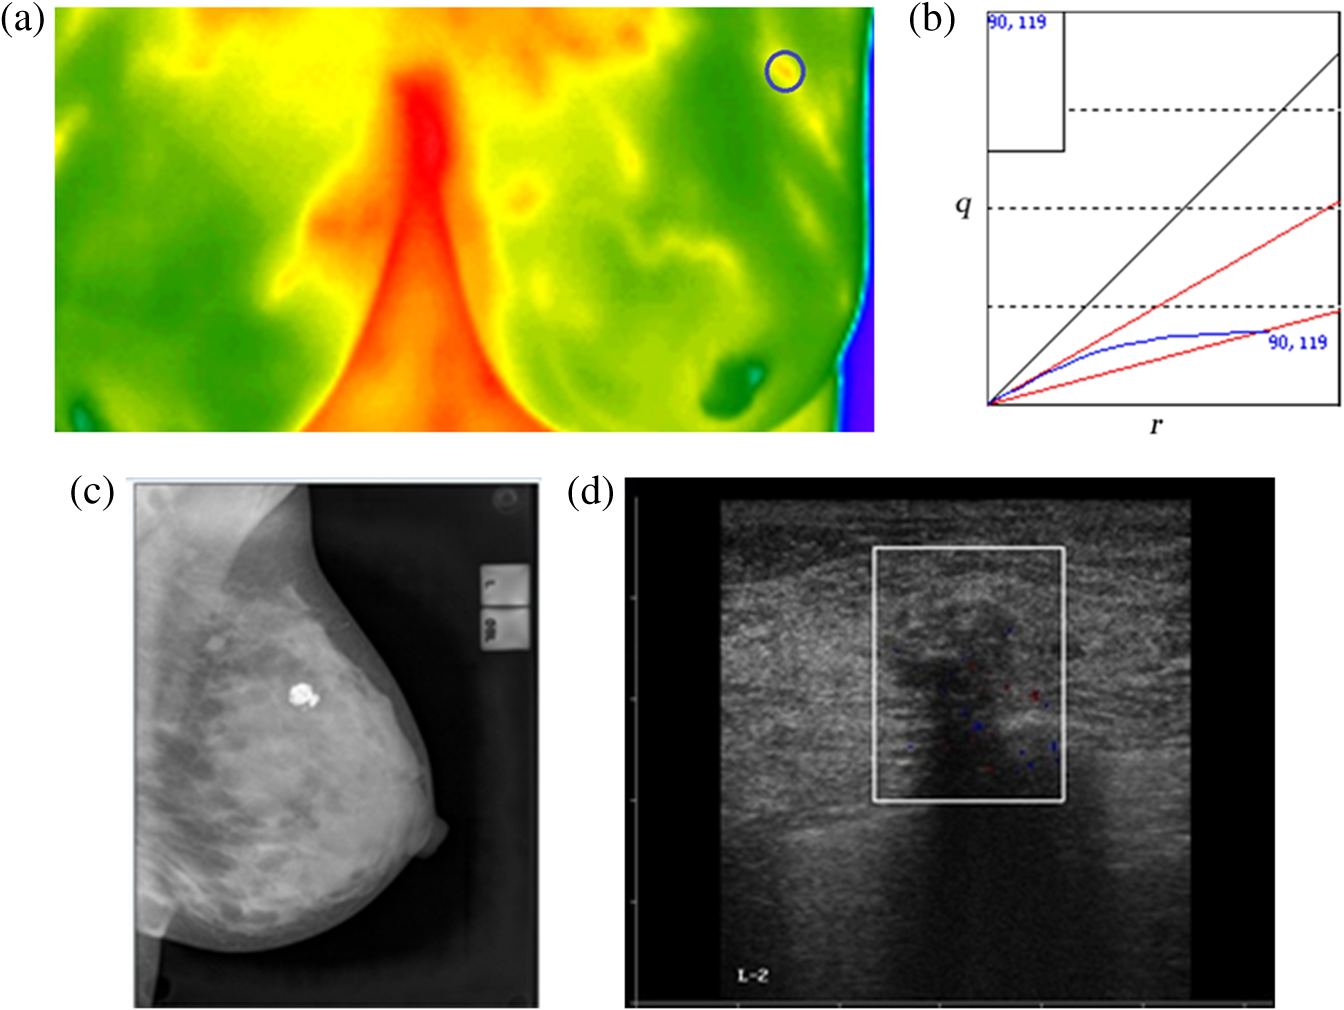 Woman D, whose infrared thermal image of breast was shown in Fig. 11(a), was 36 years old. There was an abnormal high temperature area on the upper left side of the left breast. A point was chosen at the selected area to do the curve analysis of thermal tomography, and the result was shown in Fig. 11(b). As could be seen from Fig. 11(b), the vast majority of the curve lay in the section of the benign area and the heat intensity increased with the depth of thermal tomography. Thus, it was diagnosed as benign tumor by the curve analysis. Figure 11(c) was the corresponding image of the MT x-ray, from which it could be seen that there was a round high-density shadow at the posterolateral side of the left breast, the boundary was clear, and there were no obvious lobulated edge and calcification. Figure 11(d) was the corresponding image of B-ultrasonic, which showed that there was a hypoechoic mass at the posterolateral side of the left breast, the boundary was clear, and at the posterior of the shadow, there was no significant change in the echo. The Doppler signals were strong around the mass. The two examinations above gave the result of benign tumor. By pathological examination, it was diagnosed as breast fibroadenoma. 3.3.Diagnosis of MastitisWoman E, whose infrared thermal image of breast was shown in Fig. 12(a), was 28 years old. There was an abnormal high temperature area above the right breast. A point was chosen at the selected area to do the curve analysis of thermal tomography, and the result was shown in Fig. 12(b). As could be seen from Fig. 12(b), the vast majority of the curve lay in the section of mastitis and the heat intensity increased conspicuously with the depth of thermal tomography. Thus, it was diagnosed as mastitis by the curve analysis. Figure 12(c) was the corresponding image of the MT x-ray, from which it could be seen that there existed asymmetrical density and irregular structure in the right breast and there was no obvious mass and calcification. Figure 12(d) was the corresponding image of B-ultrasonic, which also showed that there was asymmetrical density and irregular structure in the right breast and there was no obvious mass and calcification. The Doppler signals were strong. The two examinations above gave the result of mastitis. By pathological examination, it was diagnosed as mastitis. 3.4.Diagnosis of Breast HyperplasiaWoman F, whose infrared thermal image of breast was shown in Fig. 13(a), was 37 years old. There was an abnormal high temperature area on the upper left side of the left breast. A point was chosen at the selected area to do the curve analysis of thermal tomography, and the result was shown in Fig. 13(b). As could be seen from Fig. 13(b), the vast majority of the curve lay in the section of hyperplasia or normal breast and the heat intensity increased slowly with the depth of thermal tomography. Thus, it was diagnosed as hyperplasia by the curve analysis. Figure 13(c) was the corresponding image of the MT x-ray, from which it could be seen the hyperplasia was of the mammary gland and the distribution was dense. There existed nebulous masses at the inner side of the left breast. Figure 13(d) was the corresponding image of B-ultrasonic, which also showed that there was a hypoechoic area at the inner side of the left breast and the boundary was clear. The Doppler signals were weak. The two examinations above gave the result of hyperplasia. By pathological examination, it was diagnosed as hyperplasia. Fig. 13curve analysis of woman F and the corresponding comparison. (a) The infrared thermal image of woman F. (b) The curve analysis of woman F. (c) The image of MT x-ray of woman F. (d) The image of B-ultrasonic of woman F. 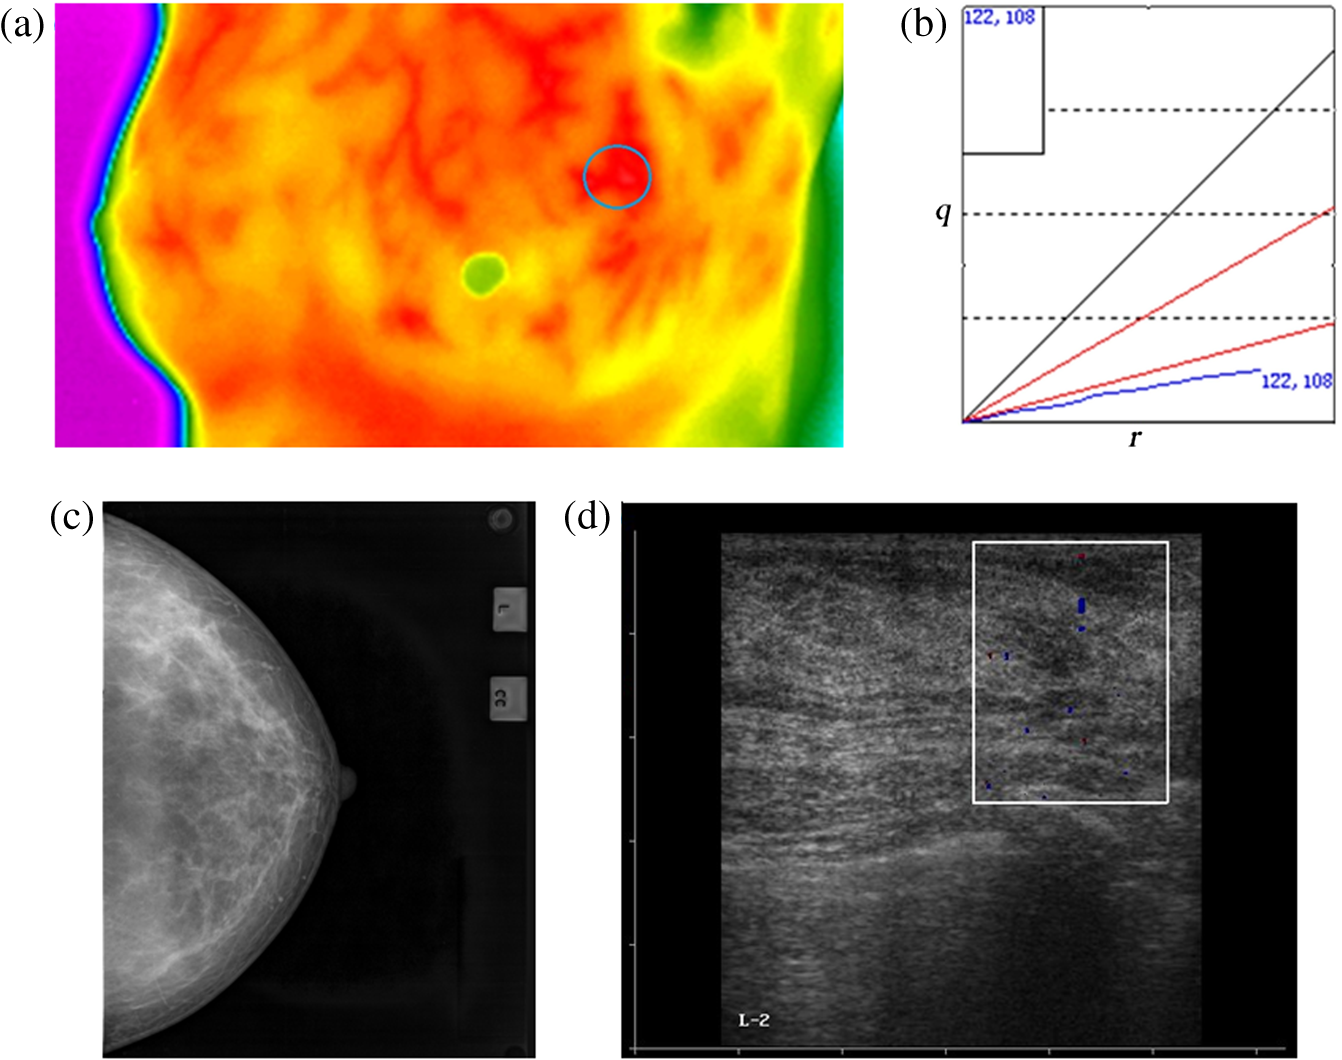 As can be seen from the six clinical practices and the comparisons above, the diagnosis results by curve are very consistent with those by MT x-ray and B-ultrasonic. This novel method of tumor diagnosis is not only noncontacting, noninvasive, and radiation free to patients, but also quick and convenient to implement. 4.ConclusionsIn order to solve the Pennes equation, the mathematical function is introduced as a point heat source to establish a suitable bioheat transfer model. Based on the thermal distribution of the human body surface, the information of an internal heat source is mined layer by layer, and then the curve of heat intensity varying with depth is acquired by combining the fitting method of the Lorentz curve. The trend and the distribution of the curve are closely related to the metabolism status of human tissue. Based on 34,977 clinical confirmed cases and statistics, the diagnostic criteria for judging diseases by the curve are proposed. Six typical clinical practices are performed and the diagnosis results are very consistent with those of B-ultrasonic and MT x-ray. In these clinical practices, there are two cases of benign breast tumor (one is cystic tumor and another is solid tumor), two cases of malignant breast tumor (one is a typical and usual malignant tumor, another is a rare malignant tumor), one case of mastitis, and one case of hyperplasia of mammary glands. It shows the cases of breast disease we chosen possess well comprehensive. In case there are multiple heat sources underneath the tissue surface that contribute to a highest temperature point on the surface, our discussion is as follows: if the distance among the multiple heat sources is relatively close and appear approximately spherical, we can take the multiple heat sources as one to analyze. However, if the heat sources are distributed in a straight line that is upright to the tissue surface, then the analysis method of the curve is not suitable for this case. Further, if there is a heat source that is physically big and appears approximately spherical, the curve can be used to analyze the disease. However, if the shape of the heat source is too different from a sphere, it is inapposite to diagnose disease with the curve. When acquiring the curve of lesions, we should avoid choosing an analysis point on the vessels, but if we cannot ensure whether the point chosen on a vessel, we might choose more a few points on the area with an abnormal temperature. In other words, our study focuses on the analysis of heat produced in the metabolic abnormalities. According to the principle of thermal tomography, this method is also suitable for many parts of the human body. The diagnostic criteria of female breast diseases have been established, and now the diagnostic criteria of thyroid diseases are in the process of being established, in which a large number of relevant cases are needed. Other parts, such as the head, abdomen, pelvic cavity, waist, arms, legs, etc., are in our future working plan. Besides the diagnosis of diseases, this novel approach of thermal tomography can also be applied in the subhealth examination, the traditional Chinese medicinal research, the paired observation of curative effects, and pesticide effects in the future. Thus, this method will be greatly valuable in clinical applications. AcknowledgmentsThis work is supported by the National Major Special Program of Scientific Instrument & Equipment Development of China (No. 2012YQ160203), the Talent Plan 3551 of Wuhan City [No. WuXinGuan-(2010) 210], the Technology Innovation Fund of the National Science and Technology Ministry of China (No. 08C26224211088). ReferencesH. H. Pennes,
“Analysis of tissue and arterial temperature in the resting human forearm,”
J. Appl. Physiol., 1
(1), 93
–122
(1948). JAPYAA 0021-8987 Google Scholar
K. Das and S. C. Mishra,
“Estimation of tumor characteristics in a breast tissue with known skin surface temperature,”
J. Therm. Biol., 38
(6), 311
–317
(2013). http://dx.doi.org/10.1016/j.jtherbio.2013.04.001 JTBIDS 0306-4565 Google Scholar
G. Carluccio et al.,
“An approach to rapid calculation of temperature change in tissue using spatial filters to approximate effects of thermal conduction,”
IEEE Trans. BioMed. Eng., 60
(6), 1735
–1741
(2013). http://dx.doi.org/10.1109/TBME.2013.2241764 IEBEAX 0018-9294 Google Scholar
H. Niu et al.,
“Comprehensive investigation of three-dimensional diffuse optical tomography with depth compensation algorithm,”
J. Biomed. Opt., 15
(4), 046005
(2010). http://dx.doi.org/10.1117/1.3462986 JBOPFO 1083-3668 Google Scholar
G. W. Lucassen, G. N. A. van Veen and J. A. Jansen,
“Band analysis of hydrated human skin stratum corneum attenuated total reflectance Fourier transform infrared spectra in vivo,”
J. Biomed. Opt., 3
(3), 267
–280
(1998). http://dx.doi.org/10.1117/1.429890 JBOPFO 1083-3668 Google Scholar
H. Chen et al.,
“A multimodal platform for nonlinear optical microscopy and microspectroscopy,”
Opt. Express, 17
(3), 1282
–1290
(2009). http://dx.doi.org/10.1364/OE.17.001282 OPEXFF 1094-4087 Google Scholar
I. R. Keyserlingk, P. D. Ahlgren and M. Yassa,
“Functional infrared imaging of the breast,”
IEEE Eng. Med. Biol., 19
(3), 30
–41
(2000). http://dx.doi.org/10.1109/51.844378 IEMBDE 0739-5175 Google Scholar
G. Fibich, A. Hammer and I. Gannot,
“Modeling and simulations of the pharmacokinetics of fluorophore conjugated antibodies in tumor vicinity for the optimization of fluorescence-based optical imaging,”
Laser. Surg. Med., 37
(2), 155
–160
(2005). http://dx.doi.org/10.1002/(ISSN)1096-9101 LSMEDI 0196-8092 Google Scholar
K. Das, R. Singh and S. C. Mishra,
“Numerical analysis for determination of the presence of a tumor and estimation of its size and location in a tissue,”
J. Therm. Biol., 38
(1), 32
–40
(2013). http://dx.doi.org/10.1016/j.jtherbio.2012.10.003 JTBIDS 0306-4565 Google Scholar
U. R. Acharya, E. Y. K. Ng and J. H. Tan,
“Thermography based breast cancer detecting using texture features and support vector machine,”
J. Med. Syst., 36
(3), 1503
–1510
(2012). http://dx.doi.org/10.1007/s10916-010-9611-z JMSYDA 0148-5598 Google Scholar
K. Y. Li, Y. G. Dong and C. Chen,
“The noninvasive construction of 3D temperature field in a biological body with Monte Carlo method,”
Neurocomputing, 72
(1-3), 128
–133
(2008). http://dx.doi.org/10.1016/j.neucom.2008.03.016 NRCGEO 0925-2312 Google Scholar
R. Helene, S. Stefanie and E. Harald,
“Tissue model for the study of heat transition during magnetic heating treatment,”
IEEE Trans. Magn., 49
(1), 244
–249
(2013). http://dx.doi.org/10.1109/TMAG.2012.2223659 IEMGAQ 0018-9464 Google Scholar
M. Schwarz et al.,
“Model-based assessment of tissue perfusion and temperature in deep hypothermic patients,”
IEEE Trans. Biomed. Eng., 57
(7), 1577
–1586
(2010). http://dx.doi.org/10.1109/TBME.2010.2048324 IEBEAX 0018-9294 Google Scholar
E. Y. K. Ng, H. M. Tan and E. H. Ooi,
“Boundary element method with bioheat equation fro skin burn injury,”
Burns, 35
(7), 987
–997
(2009). http://dx.doi.org/10.1016/j.burns.2009.01.010 BURND8 0305-4179 Google Scholar
M. Ewa, D. Grzegorz and P. Marek,
“The modelling of heating a tissue subjected to external electromagnetic field,”
Acta Bioeng. Biomech., 10
(2), 29
–37
(2008). 1509-409X Google Scholar
F. S. Loureiro, W. J. Mansur and L. C. Wrobel,
“The explicit Green’s approach with stability enhancement for solving the bioheat transfer equation,”
Int. J. Heat Mass Transfer, 76
(12), 393
–404
(2014). http://dx.doi.org/10.1016/j.ijheatmasstransfer.2014.04.064 IJHMAK 0017-9310 Google Scholar
S. Ahmad and R. Ali,
“Modeling and improvement of breast cancer site temperature profile by implantation of onion-like quantum-dot quantum-well heteronanocrystal in tumor site,”
IEEE Trans. Nanotechnol., 11
(6), 1183
–1191
(2012). http://dx.doi.org/10.1109/TNANO.2012.2213096 ITNECU 1536-125X Google Scholar
B. R. White and J. P. Culver,
“Quantitative evaluation of high-density diffuse optical tomography: in vivo resolution and mapping performance,”
J. Biomed. Opt., 15
(2), 026006
(2010). http://dx.doi.org/10.1117/1.3368999 JBOPFO 1083-3668 Google Scholar
J. Xiao, Z. Z. He and Y. Yang,
“Investigation on three-dimensional temperature field of human knee considering anatomical structure,”
Int. J. Heat Mass Transfer, 54
(9-10), 1851
–1860
(2011). http://dx.doi.org/10.1016/j.ijheatmasstransfer.2010.11.057 IJHMAK 0017-9310 Google Scholar
M. Brenner, C. Braun and M. Oster,
“Thermal signature analysis as a novel method for evaluating inflammatory arthritis activity,”
Ann. Rheum. Dis., 65
(3), 306
–311
(2006). http://dx.doi.org/10.1136/ard.2004.035246 ARDIAO 0003-4967 Google Scholar
P. K. Gupta, J. Singh and K. N. Rai,
“A numerical study on heat transfer in tissues during hyperthermia,”
Math. Comput. Model., 57
(5-6), 1018
–1037
(2013). http://dx.doi.org/10.1016/j.mcm.2011.12.050 MCMOEG 0895-7177 Google Scholar
M. L. Jose et al.,
“Procedure to estimate thermophysical and geometrical parameters of embedded cancerous lesions using thermography,”
J. Biomech. Eng-T. ASME, 134
(3), 1008
–1017
(2012). http://dx.doi.org/10.1115/1.4006197 JBENDY 0148-0731 Google Scholar
D. B. Rodrigues, P. J. S. Pereira and P. F. Maccarini,
“Study of the one dimensional and transient bioheat transfer equation: multi-layer solution development and applications,”
Int. J. Heat Mass Transfer, 62
(7), 153
–162
(2013). http://dx.doi.org/10.1016/j.ijheatmasstransfer.2012.11.082 IJHMAK 0017-9310 Google Scholar
H. Absalan and A. Maghoul,
“Simulation and investigation of quantum dot effects as inter heat-generator source in breast tumor site,”
J. Therm. Biol., 37
(7), 490
–495
(2012). http://dx.doi.org/10.1016/j.jtherbio.2012.05.001 JTBIDS 0306-4565 Google Scholar
H. Zhang et al.,
“The value-exploration of the clinical breast diagnosis by using thermal tomography,”
in 4th Int. Conf. on Natural Computation,
25
–27
(2008). Google Scholar
M. Jamil and E. Y. K. Ng,
“To optimize the efficacy of bioheat transfer in capacitive hyperthermia: a physical perspective,”
J. Therm. Biol., 38
(5), 272
–279
(2013). http://dx.doi.org/10.1016/j.jtherbio.2013.03.007 JTBIDS 0306-4565 Google Scholar
C. F. Gao, K. Y. Li and S. P. Zhang,
“A novel approach of analyzing the relation between the inner heat source and the surface temperature distribution in thermal texture maps,”
in 27th Annual Int. Conf. of the IEEE Engineering in Medicine and Biology Society,
623
–626
(2005). Google Scholar
P. Keangin, T. Wessapan and P. Rattanadecho,
“Analysis of heat transfer in deformed liver cancer modeling treated using a microwave coaxial antenna,”
Appl. Therm. Eng., 31
(16), 3243
–3245
(2011). http://dx.doi.org/10.1016/j.applthermaleng.2011.06.005 ATENFT 1359-4311 Google Scholar
BiographyGuilian Shi is a PhD candidate at the Department of Electronic Science and Technology, School of Physics and Technology, Wuhan University. His current research focuses on thermal tomography and analysis based on the infrared image of human body. His tutor is Kaiyang Li. Lin Wang is a PhD candidate at the Department of Electronic Science and Technology, School of Physics and Technology, Wuhan University. His main interests focuses on the researches on the modeling and analysis of bioheat transfer. Fei Han is a PhD candidate at the Department of Electronic Science and Technology, School of Physics and Technology, Wuhan University. Her major research field is the 3D inversed calculation on living human body. |