|
|
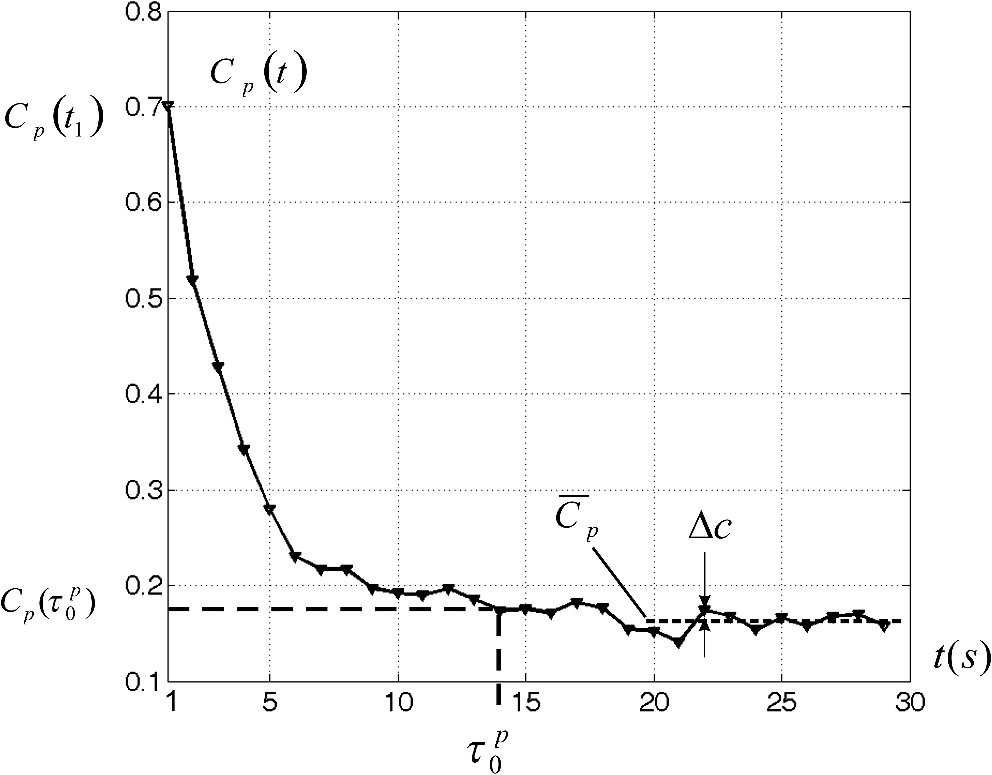
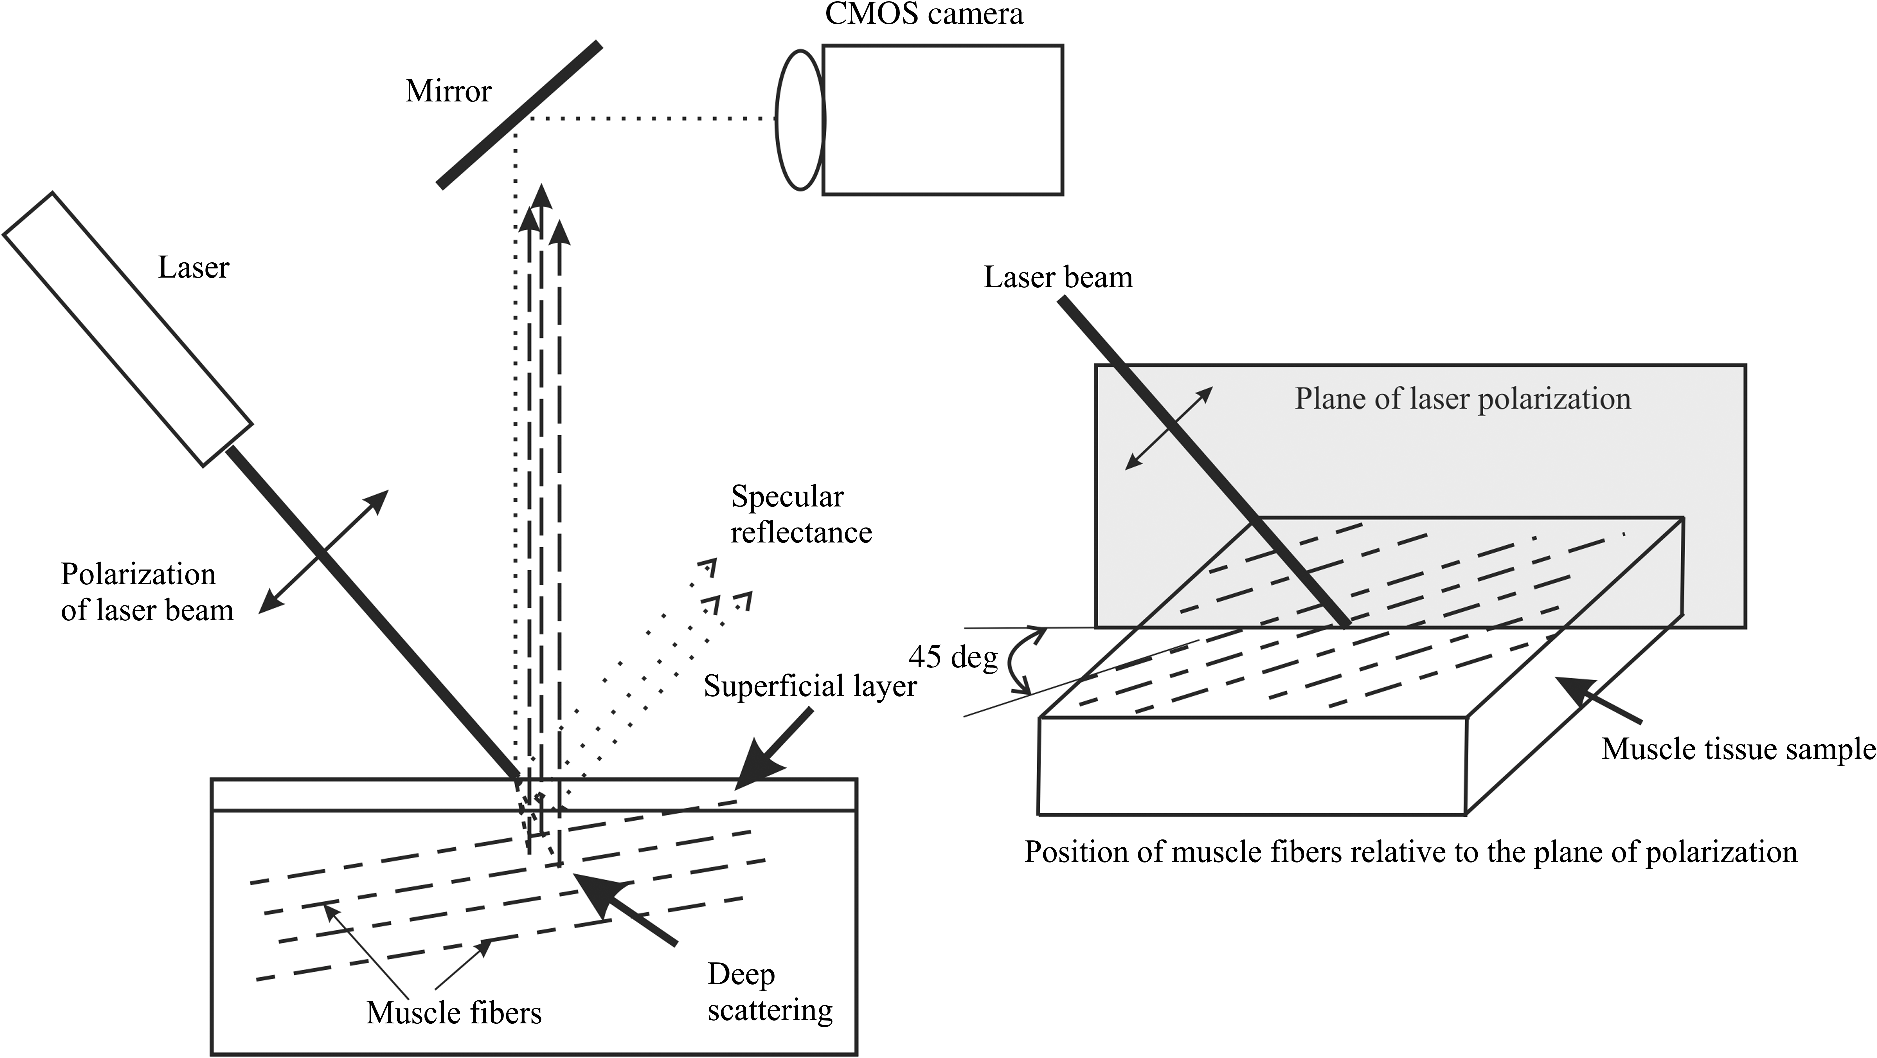
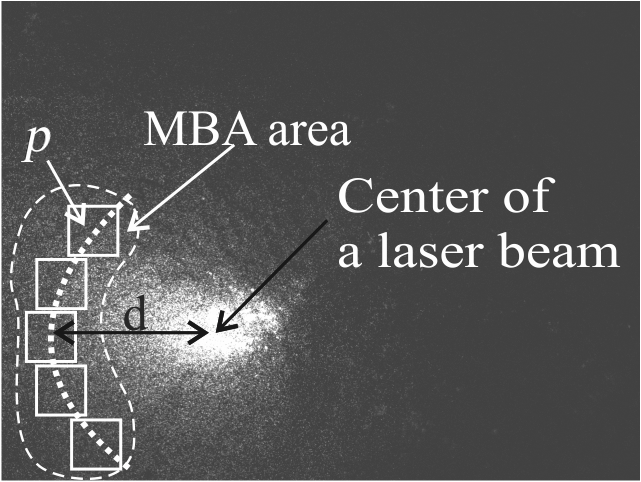
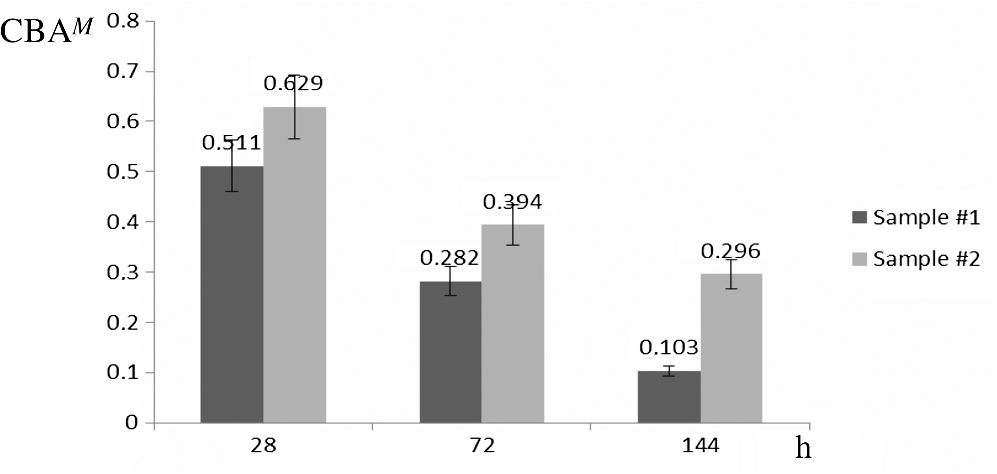
1.IntroductionDynamic speckle phenomena occur when light is scattered by biological materials. If a laser beam is directed to the surface of biological tissue, it passes through one or more layers (air space, skin, fibers, and cell walls), each of which will act as a diffuser. Hence, the laser light is diffused, absorbed, and reflected many times before a speckle field is finally formed in space. If layers within the biological material are changing, the speckle field exhibits spatial-temporal fluctuations that create a boiling structure,1 often called biospeckles. Correlations between biospeckle activity and structural and cellular changes in biological materials were marked in a number of researches. Braga et al.2 have shown that the biospeckles are the quantitative indicators of the molecular activity from roots which are grown in gel substrate in tissue culture. Amaral et al.3 have studied the connection of the biospeckle activity with the action of endogenous enzymes (calpains and cathepsins) responsible for the aging process in beef steaks. The availability of different biospeckle activities for tumor and normal tissues of domestic animals was proven in Ref. 4. There are some well-known techniques for investigation of biospeckle activity. Temporal and spatial properties of the time-varying speckles of botanical specimens by using correlation coefficients as functions of time were demonstrated by Xu et al.5 For this purpose, they recorded one-dimensional biospeckle distributions and measured correlation coefficient versus time dependencies for each pixel intensity of each scanned line of the surface. Laser speckle contrast imaging techniques are also used widely for biospeckles’ fluctuation estimation, especially for blood flow measurements in tissues such as retina, skin, and brain.6 For example, a laser speckle contrast analysis (LASCA) technique and its modifications calculate the local spatial contrast for fragments with dimensions or pixels extracted in the sequence of frames.7 Improvement of spatial resolution of the LASCA method by the laser speckle imaging technique was proposed recently by Cheng et al.8 Techniques that use a series of speckle images for estimation of speckle time evolution are also powerful tools to study the biospeckle activity. In general, the co-occurrence matrix of the speckle pattern time history9,10 and subtractive maps obtained as sums of differences,11 weighted differences,11,12 or squared differences13 between consecutive and nonconsecutive speckle patterns are used in these techniques. While studying the biological tissues by using biospeckles, the main attention is paid to agricultural vegetation. Nevertheless, investigation of farm and domestic animals’ tissues was also carried out. Motility evaluation of bovine frozen semen by biospeckle laser system to evaluate frozen semen kinetics of the bovine species was undertaken by Carvalho et al.14 The co-occurrence matrix inertia moment (IM) approach9,10 was used for statistical analysis of the speckle pattern sequences. This approach was correlated to sperm cell velocity, and the coherence between semen activity features and IM value was established. The IM approach and Fujii technique12 were successfully applied for separation of regions of cancerous and healthy tissues in dogs and cats.4 The IM was also used for estimation of biospeckle activity in beef tissues and its connection with beef aging.3 Different biophysical methods were used for assessing changes in muscle structures after slaughter.15 The speed of these changes depends on several factors including temperature and storage time. Muscle fiber ruptures, reduction of sacromere lengths, and deformation of nuclei are occurring as a result of muscle structure biochemical transformations.16 It is obvious that such muscle structure transformations can also be studied with the help of well-known2,4,5,8–14 and new temporal-spatial techniques estimating the biospeckle activity in living organisms. The appropriateness of such techniques’ applications is also validated by light modulation in sacromere structures and light anisotropy initiation in muscle fibers.17,18 In this paper, we propose to assess structural and cellular changes in muscle tissue during their long storage in a refrigerator at to with the help of a modified spatial-temporal speckle correlation (MSTSC) technique. This technique allows adequate estimation of different speckle motion velocities in different areas of the same muscle tissue sample. For this purpose, the MSTSC technique uses the coefficient of biological activity as the quantitative indicator of structural changes and activity of biochemical processes in muscle tissues. Extraction of local areas with maximum and approximately equal levels of biospeckle activity in speckle patterns of a studied object is achieved with this technique. 2.Modified Spatial-Temporal Speckle Correlation TechniqueResearch of spatial distribution of biological activity in different biological materials can also be accomplished with the help of the spatial-temporal speckle correlation (STSC) technique, which was mentioned for the first time in conference papers19 and was minutely analyzed in Ref. 20. This technique is based on correlation analysis of the time sequence of digital speckle patterns that were produced during recording throughout some temporal intervals of the same surface area of a given biological material illuminated by an expanded laser beam. In the recorded pattern sequence, each pattern is divided into by equal square fragments, and the correlation of each ’th fragment pair (; ) of two speckle patterns chosen from the sequence is done. As a result, the square matrix of correlation coefficients characterizing the temporal biological activity of the ’th fragment is produced.19 Each ’th correlation coefficient is given as where are the pixel number in the ’th fragment of the speckle pattern; ; ; ; ; is the ’th pixel intensity; is the frame number (); is the time of the first frame recording; is the interval between two adjacent frames of recorded biospeckle patterns; and is the standard deviation of the ’th fragment intensity distribution. These coefficients can be represented as normalized intensities of correlation peaks located in the center of each fragment, and temporal changes of each ’th peak intensity correspond to a tissue biological activity in limits of the chosen ’th fragment.The STSC technique was applied for the monitoring of botanical specimens’ aging by calculation of temporal and spatial fluctuations of surface area and subsurface layer biospeckle patterns. Its simplest version was based on the assumption that the biospeckle temporal changes are homogeneous over all speckle patterns. Hence, only one correlation coefficient characterizes the spatial-temporal changes of all the studied homogeneous area of a tissue surface. Temporal dependences of coefficients have allowed us to determine the freshness, aging, and other characteristics of fruits and vegetables.19,20 As the spatial distribution of biological activity of surface tissues is not uniform, the proposed Eq. (1) for correlation coefficient calculation is not applicable in some cases because areas with different speeds of speckle motion occur, as a rule, in the same ’th fragment. In order to overcome this shortcoming, we propose to extract fragments having various forms and various sizes but possessing approximately identical biological activity that is equivalent to an approximately equal level of speckle motion. In this case, it is preferable that coefficient can be applied for extracted fragment with approximately homogeneous biological activity. Thus, the modified coefficient can be expressed as where is the number of a chosen fragment.Unfortunately, the correlation coefficient , which is the determinant factor in the STSC technique, often cannot satisfactorily solve the problem of adequate estimation of the different speckle motion velocities in different areas of the same object because the background that surrounds “boiling speckles” does not change during the temporal experiment. In addition, speckle patterns of muscle tissues contain speckles which do not change in time or change very slowly. To reduce the influence of the background and static speckles on the estimation of biospeckle activity, we propose to use the coefficient of biospeckle activity () that can be expressed as where is the correlation coefficient between ’th fragments of the first and next speckle patterns (), is the decorrelation time for each ’th fragment, and is the residual value of the correlation coefficient for each ’th fragment received for the temporal interval corresponding to the decorrelation time.To estimate the decorrelation time and residual value , the fluctuation of the cross-correlation function should be taken into account. For this purpose, we determined the residual correlation coefficient and the constant level after its decrease. The constant level is calculated as a mean value of at least the five () last sample values of the correlation coefficient. If , the constant level is calculated as The residual correlation coefficient for each fragment is determined as a sum of mean value and one-tiled 97.5% confidence interval : The confidence interval value depends on the number of sample values of the correlation coefficient. If , the confidence interval is given as where is the correlation coefficient standard deviation.The typical dependence of the correlation coefficient as a function of time obtained after studying a muscle tissue sample is shown in Fig. 1. Thus, the MSTSC technique that uses the CBA is more preferable than the STSC technique for research of the spatial-temporal dynamics of biological tissues if their biological activity is distributed nonuniformly on the investigated area and speckle patterns contain practically constant background and invariable in time speckles. 3.Application of the Modified Spatial-Temporal Speckle Correlation Technique for Study of Cellular Processes in Muscle TissueApplication of the MSTSC technique to animal muscle tissues disclosed some differences in comparison with its application to fruits and vegetables. The main difference consists of other optical properties of light propagated after falling on the studied tissue, which can be explained specifically by distortion of the scattering pattern caused by a myofibril anisotropic orientation in a muscle tissue. We have also noticed that despite the dominating contribution of light scattered from muscle tissue samples used by us, the contribution of reflected light increases in comparison with contribution of light reflected from fruits and vegetables. If the expanded laser beam illuminates a muscle tissue, sidelobes of reflected beam edges can generate optical flares that decrease the speckle pattern contrast and increase the background level. In order to reduce the influence of reflected light, we used a focused laser illuminating beam which has no sidelobes of reflected beam edges influencing the speckle pattern quality. In addition, the focused beam penetrates deeper into the superficial layers of a sample. 3.1.Experimental SetupTo separate reflected and scattered waves, we use the optical scheme in which the illuminating beam is directed under an angle equal to about 45 deg to the muscle tissue surface. In this case, the reflected light is propagated from the tissue under the same opposite angle as the illuminating incident beam angle. Simultaneously, the diffuse light scattered on superficial and inner deep layers can be observed in a direction orthogonal to the tissue surface, as is shown in Fig. 2. Therefore, the orthogonal direction to the tissue surface is more suitable for a speckle pattern observation. Such an optical scheme was used in an experimental setup to study the spatial-temporal dynamics of muscle tissue cellular processes. The arrangement of this setup is shown in Fig. 3. Fig. 3Arrangement of experimental setup for study of spatial-temporal dynamics of cellular processes in muscle tissues: 1—He-Ne laser; 2—CMOS camera; 3—lens; 4—deflecting mirror; 5—cuvette with a muscle tissue sample; 6—electronic shutter; 7, 9—mounting posts; 8—sample stage; 10—rail.  The setup is mounted on a rail 10 to eliminate all possible external vibrations. A He-Ne laser beam illuminates a muscle tissue sample () inserted in a cuvette 5. Speckle patterns produced as a result of the multipath interference of scattered light are recorded with the help of a deflecting mirror 4 and a digital camera 2 (PixeLink PL-A661). The sample is illuminated only during the time when speckle patterns are captured. Such an operation is fulfilled by an electronic shutter 6 that is opened and closed synchronously with the initial and the end times of the speckle pattern recording. A direct beam reflected from the tissue surface is isolated by a blind attached to lens 3. Muscle tissue scattering characteristics depend on a laser beam incident angle, the beam polarization, and alignment of muscle fibers.21 To avoid the muscle fiber orientation influence on measurement results, all samples were prepared in order to arrange muscle fibers along the sample surface plane. The cuvette containing a sample was located in the experimental setup (see Fig. 3) during measurements to provide the direction of an incident laser beam polarization plane aligned under an angle equal to 45 deg to the direction of muscle fiber positioning, as is shown in Fig. 2. 3.2.Experimental InvestigationThe developed setup was utilized to establish the quantitative relationships between degradation processes in muscular tissue and the statistical characteristics of their speckle patterns. For this purpose, the frame series of each sample was recorded one by one during 30 to 60 s with a time delay equal to . The time exposures of each frame entered into the PC and transformed to a digital speckle pattern with dimensions pixels and 8 bit depth were equal to . In the developed optical scheme, the lateral magnification was equal to 0.55 and the average speckle size was equal to about 3 pixels for the CMOS sensor’s pixel pitch. The resolution of digital speckle patterns is defined by the lens resolution that is equal to . The average speckle size in speckle patterns was chosen according to the sampling theorem and parameters of the optical scheme used in the experimental setup.22 To ensure similar conditions for different samples during the experiment, the selected samples were stored in a refrigerator for several days prior to the experiment. Samples were withdrawn from a refrigerator directly before measurements and kept about 20 min until their temperature was equalized to room temperature. Definition of areas with maximum biospeckle activities (MBAs) on speckle patterns of the same muscle tissue was realized by calculation of CBA values in a square window that extracts square fragments with the same pixel numeration from all recorded speckle pattern series. Scanning of this window all over image fields outside the laser beam spot allows defining the spatial distribution of biospeckle activity. The dimensions of such windows were chosen from to pixels depending on the turn-down of biospeckle temporal activity spatial distribution. In order to define the MBA area, we scanned the speckle pattern series with a chosen window. We calculated CBA values for each window location that was fixed concerning adjacent previous or next window locations with a pitch less than the window dimensions. As a result, we obtained the MBA area whose boundary was defined as the CBA level that is larger than the mean value between the maximum CBA and the background CBA calculated as a simple average of CBAs over all image fields. Several areas of approximately equal biospeckle activity were selected within the MBA area. These areas were numbered as . A representative example of the MBA area within one speckle pattern selected from the speckle pattern series of the same muscle tissue is shown in Fig. 4. The MBA area is restricted by a dashed curve, and the CBA maximum within this area is located approximately at a distance from the center of a laser beam incidence on a muscle tissue. This distance on a speckle pattern corresponds to the distance equal to about on a tissue surface. A speckle pattern cannot be recorded satisfactorily at the place of the laser beam incidence because of the too large intensity of the light propagated from this place. Five pixel square fragments () with approximately identical biological activity within each fragment were chosen in all speckle patterns. The fragments placed inside the MBA area were used for further analysis. Coordinates and sizes of selected fragments were introduced into developed software, which later automatically searched for similar fragments in subsequent speckle patterns belonging to the same frame series. These fragments were used for calculation of five groups of correlation coefficients between the first and all subsequent speckle patterns with the help of Eq. (2). Dependencies of correlation coefficient as a function of correlation time were automatically obtained from the results of recorded speckle pattern processing. The distance and fragments from a speckle pattern series and calculation of the CBA were automatically found by using specially developed software in programming environment MATLAB®. For a comprehensive assessment of the proposed MSTSC technique sensitivity, it is necessary to conduct additional experimental studies and to compare the obtained results with one of the well-known methods. Therefore, the data obtained by the MSTSC technique were compared with the data obtained by Amaral et al.3 with the help of the AVD_API technique (IM of packed meat with traditional normalization). Our data show that the relative changes of the CBA values for about 5 days storage (from 28 to 144 h) of pig muscle samples in the refrigerator were reduced by almost 50% (see Fig. 5). On the other hand, relative changes of the biospeckle activity of packet meat for 5 days with the use of the AVD_ARI technique was only about 15% (see Fig. 3 in Ref. 3). Although this comparison is not entirely correct because of the different conditions of the storage of the samples, it shows that values of the CBA decrease much faster than AVD_ARI for the same time storage. 4.Analysis of in Pig and Chicken Muscle Tissue SamplesEight pig muscle samples and the same quantity of chicken samples were selected for experiments. Four samples from each domestic animal were stored at and the same quantity was stored at . CBA values were defined for each sample. The results have shown that the calculated CBA and RMS error values differ slightly between themselves. Therefore, only the characteristic results were represented for two samples at different storage temperatures. The averaged values were calculated for pig and chicken muscle tissue samples. Changes of mean value averaged on all five similar fragments (see Fig. 3) for two pig muscle tissue samples are shown in Fig. 5. The first sample (#1) was previously stored for 28, 72, and 144 h at after slaughter, and the second one (#2) for 28, 72, and 144 h at . The similar results represented in Fig. 6 were obtained for two chicken muscle tissue samples. The first sample was previously stored for 3, 24, and 48 h at after slaughter, and the second one for 3, 24, and 48 h at . All manipulations with animals during preparations of samples were fulfilled in accordance with the European Convention for the Protection of Vertebrate Animals used for Experimental and Other Scientific Purposes (Council of Europe; ETS no. 123; Strasbourg, 18.III.1986) and Law of Ukraine No. 3447—IV “On the Protection of Animals from Cruelty” (Kyiv, 21.II.2006). Fig. 6Dependencies of averaged versus storage time for #1 and #2 chicken muscle tissue samples. Indices on the top of each bar indicate the standard deviation’s measurement spread of the averaged . 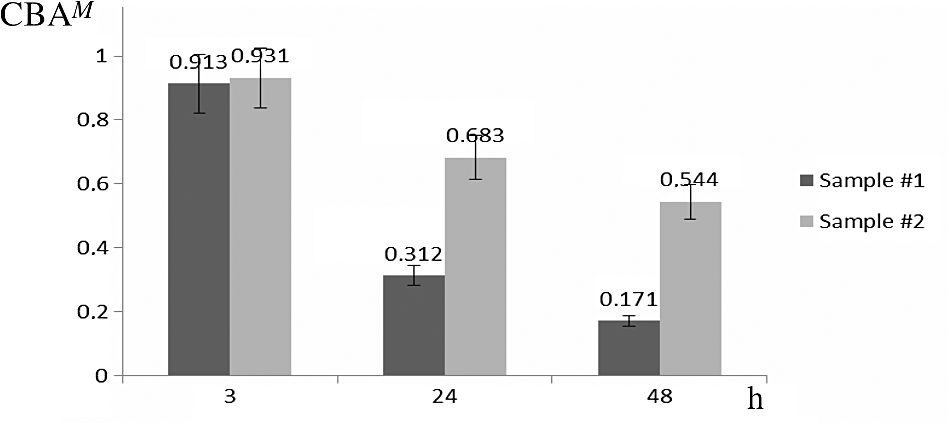 The results of experimental research have shown that physical and chemical aging processes in muscle tissue lead to a monotonic decrease of , which depends strongly on duration and temperature storage. Measurement results shown in Fig. 5 for a pork muscle sample stored at have illustrated that the for this sample is changed more slowly in comparison with for the sample stored at . Let us also note that the values are approximately equal to unity for chicken samples at 3 h after slaughter, as is shown in Fig. 6. The decrease and temperature increase as functions of storage time reflect the muscle tissue destruction processes, which characterize its aging (autolysis, degradation of cellular membranes, and distress of membrane permeability). It is necessary to note that biological processes in muscle tissues characterize different spatial activities in the chosen fragments. Such a heterogeneity of biological processes is demonstrated in Table 1, in which values of the for a pig muscle tissue calculated using Eq. (3) are represented. This table indicates that the for all five fragments shown in Fig. 4 is slightly different. Standard deviations of the value characterizing the measurement uncertainty and difference of the samples were calculated as Table 1Statistical and temporal parameters for five rectangular fragments of a pig muscle tissue stored in frozen conditions.
Note: CBAp = coefficient of biospeckle activity of p-fragment; CBAM = mean value of CBAp; SDCBA = standard deviation of CBAp. The results of calculations are also represented in Table 1. After the slaughter, the physical–chemical and biological processes of autolysis are started in muscle tissue. The ultrastructural and histological changes of tissues are most significant on the cellular and tissue levels. Typical examples of such changes are the initiation of muscle fiber cracks and ruptures, reduction of sarcomers, nuclei deformation, nuclear chromatin diminishing, and destruction of mitochondria. These factors, as well as the temperature and microorganism influence, affect the dynamics of biospeckles of muscle tissue. Therefore, the proposed response of biospeckle activity provides an integrated assessment of these biological processes that take place in muscle during storage. 5.ConclusionsThe MSTSC technique is proposed and used for research of muscle tissue biological activity. To estimate the biospeckle spatial-temporal statistics, the coefficient of bioactivity () is proposed as a quantitative indicator of the overall activity of the physical and chemical processes in muscle tissue. The proposed takes into account the decorrelation time and the difference of correlation coefficients that characterize muscle tissue bioactivity. The experimental setup for the study of biospeckle activity in a muscle tissue is developed. The experimental results have shown that the values properly evaluate the reduction of the bioactivity levels of chicken and pig muscle tissues if they are stored in a refrigerator for a relatively long time. AcknowledgmentsWe are grateful to Kotsiumbas I. Ya., Tkachenko V. I., and Korobova O. V. from “State Scientific-Research Control Institute of Veterinary Medicinal Products and Feed Additives” for provision of samples and discussion of results. ReferencesT. Asakura and N. Takai,
“Dynamic laser speckles and their application to velocity measurements of the diffuse object,”
Appl. Phys., 25 179
–194
(1981). http://dx.doi.org/10.1007/BF00902971 APPYEK 1080-9198 Google Scholar
R. A. Braga et al.,
“Live biospeckle laser imaging of root tissues,”
Eur. Biophys. J., 38
(9), 679
–686
(2009). http://dx.doi.org/10.1007/s00249-009-0426-0 EBJOE8 0175-7571 Google Scholar
I. C. Amaral et al.,
“Application of biospeckle laser technique for determining biological phenomena related to beef aging,”
J. Food Eng., 119
(1), 135
–139
(2013). http://dx.doi.org/10.1016/j.jfoodeng.2013.05.015 JFOEDH 0260-8774 Google Scholar
R. A. Braga et al.,
“Biospeckle numerical values over spectral image maps of activity,”
Opt. Commun., 285
(9), 553
–561
(2012). http://dx.doi.org/10.1016/j.optcom.2011.10.079 OPCOB8 0030-4018 Google Scholar
Z. Xu, C. Joenathan and B. M. Khorana,
“Temporal and spatial properties of the time-varying speckles of botanical specimens,”
Opt. Eng., 34
(9), 1487
–1502
(1995). http://dx.doi.org/10.1117/12.199878 Google Scholar
Y. A. Aizu and T. Asakura,
“Bio-speckle phenomena and their application to the evaluation of blood flow,”
Opt. Laser Technol., 23
(4), 205
–219
(1991). http://dx.doi.org/10.1016/0030-3992(91)90085-3 Google Scholar
J.D. Briers, G. Richards and X.W. He,
“Capillary blood flow monitoring using laser speckle contrast analysis (LASCA),”
J. Biomed. Opt., 4
(1), 164
–175
(1999). http://dx.doi.org/10.1117/1.429903 JBOPFO 1083-3668 Google Scholar
H. Cheng et al.,
“Modified laser speckle imaging method with improved spatial resolution,”
J. Biomed. Opt., 8
(3), 559
–564
(2003). http://dx.doi.org/10.1117/1.1578089 JBOPFO 1083-3668 Google Scholar
A. Oulamara, G. Tribillon and J. Doubernoy,
“Biological activity measurements on botanical specimen surfaces using a temporal decorrelation effect of laser speckle,”
J. Mod. Opt., 36
(2), 165
–179
(1989). http://dx.doi.org/10.1080/09500348914550221 JMOPEW 0950-0340 Google Scholar
R. Arizaga, M. Trivi and H. Rabal,
“Speckle time evolution characterization by the co-occurrence matrix analysis,”
Opt. Laser Technol., 31
(2), 163
–169
(1999). http://dx.doi.org/10.1016/S0030-3992(99)00033-X OLTCAS 0030-3992 Google Scholar
R. Arizaga et al.,
“Display of the local activity using dynamical speckle patterns,”
Opt. Eng., 41
(2), 287
–294
(2002). http://dx.doi.org/10.1117/1.1428739 Google Scholar
H. Fujii et al.,
“Evaluation of blood flow by laser speckle image sensing. Part 1,”
Appl. Opt., 26
(24), 5321
–5325
(1987). http://dx.doi.org/10.1364/AO.26.005321 APOPAI 0003-6935 Google Scholar
A. V. Saúde et al.,
“Alternative measures for biospeckle image analysis,”
J. Opt. Soc. Am. A, 29
(8), 1648
–1658
(2012). http://dx.doi.org/10.1364/JOSAA.29.001648 JOAOD6 0740-3232 Google Scholar
P. H. Carvalho et al.,
“Motility parameters assessment of bovine frozen semen by biospeckle laser (BSL) system,”
Biosyst. Eng., 102
(1), 31
–35
(2009). http://dx.doi.org/10.1016/j.biosystemseng.2008.09.025 Google Scholar
J. L. Damez and S. Clerjon,
“Meat quality assessment using biophysical methods related to meat structure,”
Meat Sci., 80 132
–149
(2008). http://dx.doi.org/10.1016/j.meatsci.2008.05.039 MESCDN 0309-1740 Google Scholar
T. Kołczak et al.,
“Changes in structure of psoas major and minor and semitendinosus muscles of calves, heifers and cows during post-mortem ageing,”
Meat Sci., 64
(1), 77
–83
(2003). http://dx.doi.org/10.1016/S0309-1740(02)00164-X MESCDN 0309-1740 Google Scholar
J. Xia et al.,
“Monitoring sarcomere structure changes in whole muscle using diffuse light reflectance,”
J. Biomed. Opt., 11
(4), 040504
(2006). http://dx.doi.org/10.1117/1.2234278 JBOPFO 1083-3668 Google Scholar
J. Ranasinghesagara and G. Yao,
“Imaging 2D optical diffuse reflectance in skeletal muscle,”
Opt. Express, 15
(7), 3998
–4007
(2007). http://dx.doi.org/10.1364/OE.15.003998 OPEXFF 1094-4087 Google Scholar
L. I. Muravsky, O. P. Maksymenko and L. F. Frankevych,
“Studying of botanical specimen ageing with spatial-temporal speckle correlation technique,”
in 3rd Int. Scientific Conf. Influence of Electromagnetic Field on Agricultural Environment “AGROLASER 2006”,
83
–89
(2006). Google Scholar
A. Zdunek et al.,
“New nondestructive method based on spatial-temporal speckle correlation technique for evaluation of apples quality during shelf-life,”
Int. Agrophys., 21
(3), 305
–310
(2007). INAGEX 0236-8722 Google Scholar
J. R. Zijp and J. J. ten Bosch,
“Optical properties of bovine muscle tissue in vitro; a comparison of methods,”
Phys. Med. Biol., 43 3065
–3081
(1998). http://dx.doi.org/10.1088/0031-9155/43/10/026 PHMBA7 0031-9155 Google Scholar
M Sj’dahl and L.R. Benckert,
“Systematic and random errors in electronic speckle photography,”
Appl. Opt., 33
(31), 7461
–7471
(1994). http://dx.doi.org/10.1364/AO.33.007461 APOPAI 0003-6935 Google Scholar
BiographyOleksandr P. Maksymenko is a senior staff scientist at the Karpenko Physico-Mechanical Institute of NASU. He received his BS and MS degrees radioengineering in 1980 and 1982, respectively, and his PhD in 1997. In 2007, the degree of senior researcher was conferred on him in the field of information extraction and processing. He is the author of more than 60 journal papers. His current research interests include optical-digital systems for diagnostics, speckle metrology, and laser application. Leonid I. Muravsky received his diploma in 1975, PhD in 1989, and DrSci in 2002. He is the head of Department of the Karpenko Physico-Mechanical Institute at Lviv and professor at the National University “Lvivska Politechnica,” Ukraine. His scientific interests include speckle metrology, optical interferometry, and image processing. He is the author of six books and about 180 technical papers. He has been a regular SPIE member since 1996 and SPIE senior member since 2014. |
||||||||||||||||||||||||||||||||||||||||||||||||||||||||||||||||||||||||||||||||||||||||||||||||||||||||||||||||||||