|
|
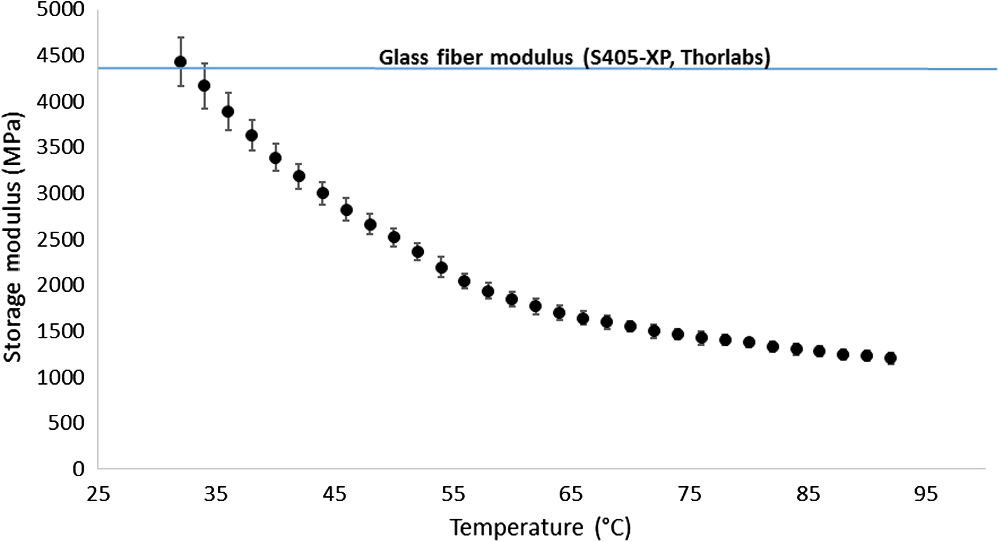
1.IntroductionSince the late 1960s, many studies have been performed on silica fibers in an attempt to characterize and improve the product that would revolutionize telecommunications and the medical field.1 Applications that utilize fiber optics are extensive, ranging from the transmission of data at extremely high speeds to allowing physicians to get a better look at patients via endoscopy. Silica fibers benefit from having resistance to electromagnetic interference, chemical stability, and multiplexing capabilities.2,3 These benefits are not exclusive only to silica fibers as much research has been performed on using polymers such as polymethyl methacrylate (PMMA) and polystyrene as optical sensors. Polymer optical sensors (POSs), although possessing higher attenuation, are a cheaper alternative for sensing applications, while retaining the chemical and electromagnetic resistance seen in the common silica fibers. In addition to these advantages, the weight and ease of manufacturing have helped pique the interest of researchers.1 For example, the temperatures for spinning of PMMA fibers via melt spinning are generally around 100°C to 300°C compared with the 1500°C or higher for glass fibers.4,5 Both silica and POSs often utilize a evanescent sensing technique, which has emerged as one of the more prevalent sensing methods.6 In one variation of this technique, a portion of the cladding is removed, and the surface is coated with an absorbing medium. As light travels down the fiber, its evanescent field is able to interact with the absorbent coating. From the interaction, changes in light propagation caused by refraction index changes increase the number of modes and sensitivity for light sensing, all which can then be measured and analyzed by a detector.1,6,7 Dong et al.8 were able to produce a broad-range silica pH sensor that relied on several indicator dyes immobilized on the surface of the glass through sol–gel cladding. Yang and Wang9 also showed similar results for pH sensing using fluorescein and a microstructured PMMA fiber. Our study utilizes the evanescent wave fluorescence technique to observe the amount of light that is able to cause fluorescence excitation in a functionalized fiber without cladding and at various conditions. Although the evanescent field sensing has proven to be a reliable technique, much less work has been carried out on producing a fiber that utilizes both the surface and the interior as sensors. Swelling upon contact with water can be detected using polyvinyl alcohol (PVA) fibers. This is not possible with glass or PMMA fibers because water cannot be absorbed readily at low temperatures. PVA is also known for its ability to swell in an aqueous environment.10 In the presence of water, PVA exhibits mechanical switchability, from rigid to soft.11 Stiffness ranges for PVA have been registered at 7300 MPa when dry, but then it decreases to 1630 MPa when wet. These values are orders of magnitude higher than tissue, but studies have shown that the reduction in stiffness is enough to significantly reduce the inflammation response.12 Many emerging studies show the effect of rigidity of implants, such as neural electrodes, on the body.13–17 Although they are excellent for the short term, in chronic cases, the electrodes eventually fail because of brain tissue reaction that causes neuroinflammatory response, glial encapsulation, and scarring.18 PVA’s mechanical switchability creates a material whose modulus is much closer to that of human tissue compared with silica or PMMA fibers. Although the modulus is three magnitudes away from the stiffness of cartilage, when compared with silica fibers, PVA fibers have shown to exhibit a modulus similar to silica when dry during implantation but significantly decreases when wet. The wet modulus has been shown to be low enough to significantly reduce inflammation and tissue response.12,19,20 This theory was examined by Potter et al.19 Who observed the beneficial effects of mechanically switchable PVA fibers in the brain compared with the commercially available materials. They showed that the more flexible and soft PVA closely emulated the stiffness of the surrounding tissue at the implantation site, the greater reduction in neuroinflammation, glial encapsulation, and scarring. In a subsequent study, Jorfi et al.12,21 furthered the research by investigating the optical properties of these PVA fibers and showed that although the mechanical transition from rigid to flexible does exhibit a decrease in the optical transmission of the PVA-based optical fibers, the loss is not significant when applied to optogenetics applications where minimal distances are used. With rising healthcare costs, obtaining reliable results through cheaper methods is of great interest. To date, most fiber optic sensing research has been focused on using polymers as a coating on glass fibers, which does not take advantage of the lower cost of using the off-the-shelf, cheaper material. Using the polymer as a coating on rigid substrates also does not utilize the polymers mechanical switchability that has been seen to illicit less of an immune response from the human body. In this paper, a polymer sensor in which the entirety of the fiber is made of functionalized PVA is proposed; it is envisioned to be attached to the end of a probe to come in contact with tissue and is capable of sensing changes in pH while also exhibiting mechanical switchability. This material can be used in the detection of colon cancer or abnormal pH levels in the colon. Lower pH values have been shown to equate toward cancerous cell generation or lead to discomfort. With a typical pH range of 5.5 to 7.4, the colon health can be monitored through its pH. The fibers developed show a change in transmittance within this range, allowing for signaling during colonoscopies. The lower stiffness when wet provides more comfort for the patient during these routine examinations.22 Such a material would not only allow for reliable detection of pH but also be able to be used for extended periods of time and cause minimal scaring as the modulus of the material closely mimics the mechanics of the human body tissue. 2.Materials and Methods2.1.MaterialsPVA (99% hydrolyzed; to ), fluorescein isothiocyanate (FITC), pyridine, dibutyltin dilaurate, sodium citrate monobasic, and fluorescein sodium salt were acquired from Sigma-Aldrich (St. Louis, Missouri) and used without further purification. Dimethyl sulfoxide (DMSO) and methanol were purchased from Thermo Scientific (Waltham, Massachusetts) and Spectrum, respectively. Hydrochloric acid (37%) was purchased from Spectrum Chemical (New Brunswick, New Jersey). Optical equipment consisted of light-emitting diode (LED) lamps (M490F2 and M530F1; Thorlabs, Newton, New Jersey), which emit 490- and 530-nm light, respectively. The M490F2 was 350 mA, 1.5 mW (min) with a bandwidth (FWHM) of 23 nm, while the M530F1 was 1000 mA, 4.0 mW (min) with a bandwidth (FWHM) of 33 nm. These lamps along with an S120VC photodiode power sensor, bare fiber adapter, and the PM100USB power and energy meter were all purchased from Thorlabs (Newton, New Jersey). All specifications and technical information are readily available on Thorlabs.com. The NE-1000 programmable syringe pump was purchased from New Era Pump Systems Inc. (Farmingdale, New York), and the syringe needles were custom manufactured by Hamilton (Reno, Nevada). 2.2.Functionalization of Polyvinyl AlcoholFunctionalizing of PVA with FITC to make fluorescein-labeled PVA (F-PVA) was modified from Kaneo et al.23 with small alterations and can be seen in Fig. 1. In brief, 608 mg of PVA was dissolved in a beaker containing 16 mL of DMSO and of pyridine. Once fully dissolved, 6 mg of FITC was added to the solution while stirring on a hot plate. The solution was brought to 95°C, and to catalyze the reaction, of DBDT was added. Then, the solution was magnetically stirred at 450 rpm for 2 h. Being light sensitive, the beaker was wrapped in tin foil to protect it. The solution was then poured into a 50-mL centrifuge tube. Then, 35 mL of butanol was added and vigorously shaken using an analog vortex mixer and by hand before being spun at 5000 rpm for 2 min. The resulting supernatant was poured out and disposed of, and the process of adding butanol, spinning, and disposing of the supernatant was repeated five times. The pellet was transferred into a new beaker and protected from light with aluminum foil. The sample was then placed in a vacuum oven at 80°C overnight after which the resulting fluorescein-functionalized PVA (F-PVA) was ready for spinning. Fig. 1Attachment of FITC to PVA to create a dye functionalized polymer (F-PVA). The process was carried out using dibutyltin dilaurate as a catalyst in a DMSO at 95°C for 2 h. Experiment is outlined in Sec. 3.2.  2.3.Preparation and Wet Spinning of Polyvinyl Alcohol and Fluorescein-Labeled Polyvinyl AlcoholThe technique of wet spinning the PVA and F-PVA fibers was modified from Jorfi et al.11 A solution of F-PVA was prepared by adding 0.25 g of F-PVA and 1.35 g of PVA to a vessel containing a solution of (Deionized) and DMSO. This solution was heated to 95°C and stirred until the PVA was fully dissolved. The mixture was then loaded into a 10-mL syringe equipped with a 25.4-cm 17 gauge (1.07 mm inner diameter) blunt tip needle that was bent into a gradual 90-deg turn. The exact layout is provided in Fig. 2. The glass tube was filled with methanol. The syringe was loaded into the syringe pump, which was then set to and gradually lowered until an interface was formed by the methanol and PVA/F-PVA solution. Flow speed was then lowered to . Once a consistent stream formed, the syringe pump was cut and the gelatinous fiber was removed from the needle tip and transferred to a bottle of clean methanol. Fibers were kept in methanol for 24 h and then in methanol at room temperature for 24 h. The fibers were then transferred onto a sheet of Teflon and allowed to dry at room temperature in a dark cabinet overnight. The next day, the fibers were transferred to a 50°C oven overnight. The final drying step was in the 150°C oven for 15 min. These fibers swelled when placed in water, increasing in length and width by and , respectively. Fig. 2Setup for wet spinning of PVA/F-PVA fibers. A syringe containing the F-PVA solution is placed in a syringe pump and slowly injected into a glass tube filled with methanol. The needle was positioned just above the methanol and was lowered until an interface formed. DMSO and water diffuse out of the fiber causing the now insoluble F-PVA to solidify.  SEM images of the fibers sputter coated with palladium show a relatively smooth surface with some striations. Most notable is a long wavy feature that covers almost the entire length of the fiber. It is likely that this feature is either caused by the turbulence when the liquid F-PVA solution meets the stagnant methanol or from some microscopic protrusion on the needle tip that disrupts the stream. These images are shown in Fig. 3 along with the image from an inverse light microscope showing the end of the fiber. 3.Results and Discussion3.1.Optical Properties Perpendicular SetupFluorescein is a commonly used florescent dye with absorbance maxima at about 490 nm and emission maxima around 515 nm. Doughty investigated the changes in fluorescein absorbance with changing pH and found that as the pH decreased, absorbance also decreased.24,25 To control the pH of the fiber, the fiber was submerged in a sodium citrate buffer solution with varying amounts of 0.1 M HCl solution to maintain the pH levels tested. Figure 4 shows the UV–Vis spectra of a solution containing 11 mg of spun F-PVA fiber dissolved in DMSO before and after the addition of 0.1 M HCl. The transmittance through the fibers was obtained using M490F2 and M530F1 LED sources coupled with an S120VC photodiode power sensor. Fibers were setup using two methods as shown, in Fig. 5. The first method has the light source positioned at one end of the fiber and a sensor at the other (linear) end. In the second method, the light source was positioned so that the direction it was emitting light was perpendicular to the optical axis of the fiber. These two methods were investigated because the linear set is best suited for in vivo applications, whereas the perpendicular set is used for in vitro applications. Fig. 4UV–Vis absorbance spectra of F-PVA in DMSO and HCl. Eleven milligram of spun F-PVA fiber was dissolved into 1 mL of DMSO. F-PVA at neutral pH (solid line) and F-PVA at in 0.1 M HCl (pH 1) (dashed line).  Fig. 5(a) Linear setup with the source opposite the detector. (b) Perpendicular setup with the source at a 90-deg angle to direction of the fiber. The linear setup is perfect for in vivo applications, whereas the perpendicular setup is viable for in vitro applications.  Initial tests of the PVA fibers that did not contain any fluorescein yielded results in line with what we expected. The light simply passed through the fiber and did not travel down its length, resulting in minimal transmittance. With the dry F-PVA, the light struck the fluoresceins that then fluoresced transmitting light down the length of the fiber. Once the fibers were soaked for approximately 5 min, the amount of light transmitted down the fiber decreased as expected. Studies have shown that the fiber possesses the ability to return to a dry state within 30 min, but this experiment was not conducted as the goal of the device is to be implanted and then removed.12 Further reduction in transmittance was observed once HCl was added to the cuvette, and the response was almost immediate (Fig. 6). The reason for this further reduction in transmittance when HCl is added is that as the pH decreases, the absorbance and emission abilities of fluorescein diminish. Light from the LED no longer activates the fluoresceins and simply passes through the fiber. Fig. 6Changes in transmittance with F-PVA fiber dry (•), wet (∘), and after HCl addition (pH 1) (▪).  Interestingly, when sodium citrate buffer was used to investigate a stepwise decrease of pH, the fibers acted differently than before. Instead of a significant decrease in transmittance upon wetting, an increase was observed. Studies by other researchers showed that the ionic strength of the solution significantly affects the fluorescent properties of fluorescein.25 Sjöback et al. explains that as ionic strength increases, there is a buildup of the dianionic form of fluorescein causing increased emission intensity. Other than this feature, the fluorescein acted as expected, having very distinguishable points at each pH tested (see Fig. 7). Fig. 7Transmittance of F-PVA fiber as a function of pH, in citrate buffer, pH 6.5, 6.0, 5.5, 5.0, 4.5, 4.0, and 3.5 using a 490-nm LED source and the perpendicular setup. As the pH decreased, transmittance decreased as well. Normalized values show the power at each pH as a percentage of the highest value achieved, which was at pH 7 for all fibers tested. and the error bars represent deviation from the mean.  This same setup was used to observe the effect of temperature on the transmittance, and the results are shown in Fig. 8. The fiber and a sodium citrate solution container were placed in a low-temperature precise oven to regulate the temperature between 25°C and 37°C. Before starting the transmission testing, submerged fibers were isothermally held for 5 min. With increasing temperature and constant pH, the temperature range was taken from room temperature to body temperature. A maximum temperature at 37°C was chosen because of intention of in vivo applications. All tests were run regardless of their decreased pH with the exception of pH 7, which was relatively constant. Compared with the data in Fig. 9, the transmittance values begin to plateau at pH 7, so it is believed that the same response occurs in the set of temperature experiments. This is because of the stray light reaching the sensor, but from the data in Fig. 9 showing pH changes with transmittance, the 37°C at pH 7 power values decrease to a level similar to those seen by other pHs. Fig. 8Effect of temperature on transmittance of F-PVA fiber with varying pH, in citrate buffer, pH 7, 6, 5, 4, and 3 using a 490-nm LED source. With an increase in temperature, the transmittance decreased. 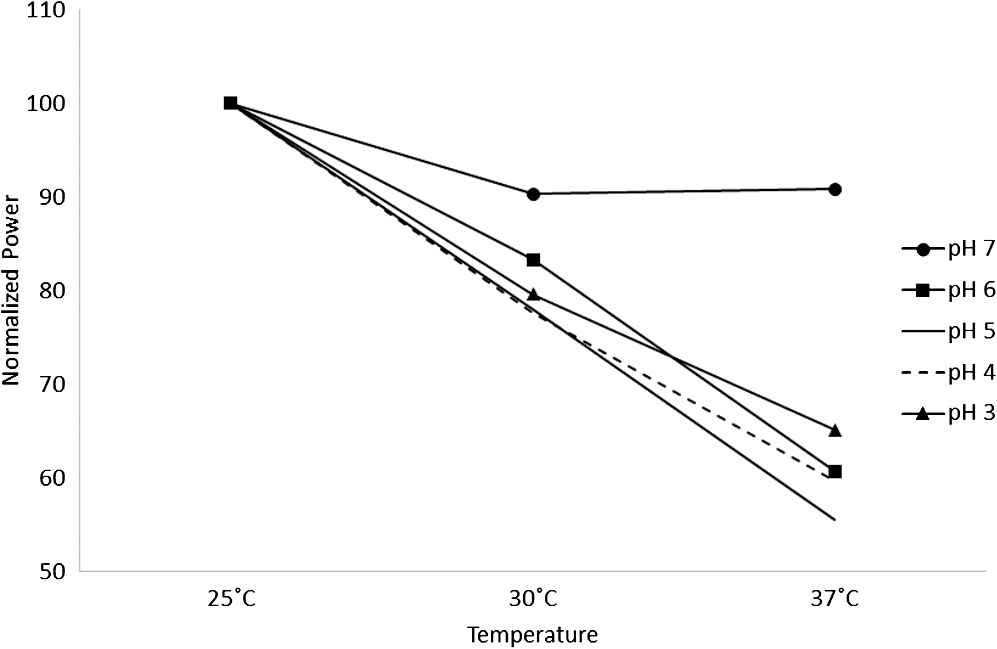 Fig. 9Normalized power of F-PVA fibers () using linear setup. The highest variability was seen at pHs 4 to 6, where the sensitivity of fluorescein is greatest. Normalized values show the power at each pH as a percentage of the highest value achieved, which was at pH 3 for all fibers tested. Error bars represent the deviation from the mean.  3.2.Optical Properties Linear SetupWhen the LED and the sensor were setup at opposite ends of the clear fiber, transmittance values were excellent (not shown). The F-PVA fiber showed excellent response to changing pH, as seen in Fig. 9, which shows the normalized power for four F-PVA fibers. When using the F-PVA fiber, we also switched to the 530-nm source because the response was better. This is because the activation of our fluoresceins occurs at a wavelength of about 520 nm, which is much closer to the 530-nm LED than the 490-nm LED. The absorption spectra are shown in Fig. 4. We also observed that with the higher values, the background noise plays a lesser role. As shown in Fig. 9, for the linear setup, the pH decreases while the transmittance increases, which is the opposite of what was observed in the perpendicular setup, but the reason for this is believed to be the same. As pH decreases, the absorbance and emission abilities of fluorescein decreas, allowing more light to pass through instead of being absorbed. In the linear setup, it passes through the detector, whereas in the perpendicular setup, it passes through as it is dispersed into the surrounding media. These results were in good agreement with the results of the glass fibers as shown by other researchers. The difference in power as pH decreased was significant with the transmittance from 2080 nW at pH 8 to 212 nW at pH 3. This wide range shows clear differences between each pH value. Dong et al.8 developed a sensor with a pH range of 4 to 13, but the power output difference between their maximum and minimum was only 140 nW, a very narrow range. With such a narrow range, the need for a more sensitive detector increases, and the difference between each pH is smaller, making it more difficult to differentiate. A detector with minimal noise is required as the difference in pH could be just a couple tens of nanowatts. Lee et al.26 developed a fiber using multiple sol–gel coatings and a sensing region of the same length used in this paper (5 cm) and observed that from pH 4 to 12, their power decreased to roughly 10% of their initial output, which is exactly the same as observed in our PVA fibers albeit within a narrower pH range (3 to 8). Lee et al. also showed results from microbent fiber sensors in a pH range of 2 to 12.27 Microbending takes advantage of the losses induced by bending of the fibers by sandwiching it between two corrugated plates. When looking at the same region, we found a similar optical power range of approximately . One problem with our setup is that the sensitivity between 7.0 and 8.0 is not very high as physiological pH is within this range. Expanding the range of this scheme could be done in multiple ways using silica fibers. The use of dyes whose range is specific to physiological pHs could be investigated as was done by Khan et al.28 who used 1-2(-pyridylazo)-2-naphthol to develop a sensor in the pH range of 7.2 to 8.4. Another problem stems from the variability between runs. Although the trend is consistent with the transmittance increasing with decreasing pH, we observe variability between each test. As shown in Fig. 9, the greatest variability observed between pH 4 and 6 is due to variation in the amount of fluorescein per unit area in the fiber. When the fiber is spun in the cold methanol, it shrinks over time with the region closest to the spinneret bearing much of the weight of the fiber compared with the lower portion of the fiber toward the bottom of the tube. This could cause the fiber to be narrower at the top than at the bottom and possibly lead to the variation that was observed. The slope of the curve is highest in this region, showing high sensitivity to the change in pH compared with the lower and higher ranges that show much less variability. Another effect of this can be seen in the actual values that were obtained. The normalized values as shown in Fig. 9 represent that power is decreased by a fairly consistent and repeatable amount with respect to the maximum value seen for each fiber, but the actual values in nW can vary significantly for each pH. Maximum and minimum powers of one fiber were between 2080 and 212 nW, whereas for another fiber, power ranged from 120 to 20 nW. As these fibers were all cut from a single longer strand, the position on the longer strand that each fiber is being taken from does affect the result. However, further testing is needed to confirm this. The normalized power shows that within a certain error, the results are repeatable; therefore, we can predict what the pH is by looking at what percentage decrease is seen. 3.3.Mechanical PropertiesDynamic mechanical analysis was done using a TA Instrument’s Q-800 with fiber clamp geometry. Testing conditions comprised of a temperature ramp at from room temperature to 90°C, 1-Hz frequency and a preload force of 0.01 N. After spinning, the fibers were left to dry under ambient conditions. Wet fibers were stored in a bath of DI water and taken out to conduct testing. A submersion clamp was not used for wet testing. Other modes of testing are possible with changing frequencies to absorb more viscoelastic properties; this study focuses on the response of the fiber with temperature change.29,30 The results showed an initial storage modulus of approximately 4700 MPa, which decreased with increasing temperature passing through an extrapolated glass transition temperature of 55°C and continued to decrease until 95°C, where it began to flatten out with a modulus of (Fig. 10). Glass transition temperature was extrapolated and found to be 55°C, and the slope continued until 95°C where it began to flatten out with a modulus of . Upon wetting, the fiber swelled and the modulus decreased to about 145 MPa (not shown). The values achieved by the dry polymer fibers were very similar to the values reported by Jorfi et al. and followed a similar profile as the temperature increased. Jorfi et al. and his team found the modulus to be around 7100 MPa when dry and 35 MPa when wet. They also showed that time-dependent measurements of the tensile storage modulus of a single-mode (SM) commercial optical fiber (S405-XP Thorlabs), which is silica core coated fiber with dual acrylate, as reference in the dry state at room temperature and upon addition of water at 37°C.12 As shown in Fig. 10, the mechanical properties of the conventional SM optical fiber remained unchanged compared with our fabricated PVA fiber. In addition to the dry state, in our fabricated PVA fiber once placed into an aqueous environment, the modulus decreased significantly to about 140 MPa (data not shown here), which is comparable with values obtained in our previous works. 4.ConclusionWhile the transmission characteristics are not on the same level as those of glass fibers, they were not expected to be. Glass fibers contain superior optical properties but carry a higher cost with them, harsher processing temperatures, no mechanical switchability, and limited use of only the surface of the fiber as a sensing region. What we showed here is that a polymer fiber can be fully impregnated with a pH responsive dye, switch between being rigid and soft depending on its environment, and yield a measurable response to changes in pH. The fibers made in this paper not only increase patient comfort but also decrease the cost of care. As stated earlier, previous works have shown clearly that a lower modulus causes less inflammation, glial encapsulation, and scarring when compared with rigid materials. When our fibers were dry, the peak modulus at room temperature was about 4700 MPa. Once placed into an aqueous environment, the modulus decreased significantly to about 140 MPa, which is comparable with values obtained in other works. When it comes to optical properties, the PVA fibers show excellent response to external stimuli in both setups. With the perpendicular setup, decreasing the pH corresponded to a decline in transmission that yielded a distinguishable curve with fairly consistent normalized power values. The linear setup had equally good results and normalized power values that were on the same level as reviewed by other researchers. The linear setup may be the better option for future application as more of the fluoresceins are hit by the light and activated. This was seen to have higher value responses, and looking into how/if signal intensity diminishes with increasing fiber length is a point of interest for future work. More work is needed to further the viability of this approach, but the work thus far has shown that mechanically switchable fibers could be used as sensors. Several areas that could help improve the fibers are related to how the fibers are made. A more uniform fiber could help reduce variability in the data and decrease attenuation. Variation was seen in the normalized power values in the linear setup, and it is believed that this could result from where the fiber is cut after spinning a long fiber. The use of multiple dyes and ensuring even distribution of the dye could also improve the working range of the fiber and provide more consistent results. Once improvements are made, the question then moves to how effective the fibers will be when surrounded by living tissue. The proteins will likely have some effect on the result, and we know this because we see it in evanescent sensing that utilizes surface functionalized reactive groups. The values achieved by evanescent sensing are extremely small.7 If tissue has a similar effect, its influence over the results should be lessened so long as we achieve higher values with large power differences between each pH. Another factor is how well the fiber is able to reflect the light, keeping it in the fiber instead of traveling out. AcknowledgmentsThis work was financially supported by the Virginia Tech Materials Science and Engineering Department and the Digges Faculty Fellowship. References
“Optical sensing and measurement,”
Handbook of Optical Sensors, 1
–2 CRC Press(2014). Google Scholar
K. Peters,
“Polymer optical fiber sensors—a review,”
Smart Mater. Struct., 20
(1), 013002
(2011). http://dx.doi.org/10.1088/0964-1726/20/1/013002 SMSTER 0964-1726 Google Scholar
P. K. Choudhury and T. Yoshino,
“On the pH response of fiber optic evanescent field absorption sensor having a U-shaped probe: an experimental analysis,”
Optik, 114
(1), 13
–18
(2003). http://dx.doi.org/10.1078/0030-4026-00210 OTIKAJ 0030-4026 Google Scholar
Y. Zhang et al.,
“Casting preforms for microstructured polymer optical fibre fabrication,”
Opt. Express, 14
(12), 5541
–5547
(2006). http://dx.doi.org/10.1364/OE.14.005541 OPEXFF 1094-4087 Google Scholar
C. Jiang et al.,
“Fabrication and mechanical behavior of dye-doped polymer optical fiber,”
J. Appl. Phys., 92
(1), 4
–12
(2002). http://dx.doi.org/10.1063/1.1481774 JAPIAU 0021-8979 Google Scholar
A. Leung, P. M. Shankar and R. Mutharasan,
“A review of fiber-optic biosensors,”
Sens. Actuators B, 125
(2), 688
–703
(2007). http://dx.doi.org/10.1016/j.snb.2007.03.010 SABCEB 0925-4005 Google Scholar
“Profile optimization of tapered waveguide sensors by fluorescence imaging,”
Proc. SPIE, 5589 70
(2004). Google Scholar
S. Dong et al.,
“Broad range pH sensor based on sol-gel entrapped indicators on fibre optic,”
Sens. Actuators B, 129
(1), 94
–98
(2008). http://dx.doi.org/10.1016/j.snb.2007.07.078 SABCEB 0925-4005 Google Scholar
X. H. Yang and L. L. Wang,
“Fluorescence pH probe based on microstructured polymer optical fiber,”
Opt. Express, 15
(25), 16478
–16483
(2007). http://dx.doi.org/10.1364/OE.15.016478 OPEXFF 1094-4087 Google Scholar
U. Fumio et al.,
“Swelling and mechanical properties of poly(vinyl alcohol) hydrogels,”
Int. J. Pharm., 58
(2), 135
–142
(1990). http://dx.doi.org/10.1016/0378-5173(90)90251-X IJPHDE 0378-5173 Google Scholar
M. Jorfi et al.,
“Physiologically responsive, mechanically adaptive bio-nanocomposites for biomedical applications,”
ACS Appl. Mater. Interfaces, 5
(4), 1517
–1526
(2013). http://dx.doi.org/10.1021/am303160j AAMICK 1944-8244 Google Scholar
M. Jorfi et al.,
“Physiologically responsive, mechanically adaptive polymer optical fibers for optogenetics,”
Opt. Lett., 39
(10), 2872
–2875
(2014). http://dx.doi.org/10.1364/OL.39.002872 OPLEDP 0146-9592 Google Scholar
M. Jorfi et al.,
“Progress towards biocompatible intracortical microelectrodes for neural interfacing applications,”
J. Neural Eng., 12
(1), 011001
(2015). http://dx.doi.org/10.1088/1741-2560/12/1/011001 1741-2560 Google Scholar
M. Jorfi et al.,
“Mechanically adaptive materials for intracortical implants,”
in 7th Annual Int. IEEE EMBS Conf. on Neural Engineering,
601
–602
(2015). Google Scholar
A. P. Kelsey et al.,
“Stab injury and device implantation within the brain results in inversely multiphasic neuroinflammatory and neurodegenerative responses,”
J. Neural Eng., 9
(4), 046020
(2012). http://dx.doi.org/10.1088/1741-2560/9/4/046020 1741-2560 Google Scholar
J. P. Harris et al.,
“Mechanically adaptive intracortical implants improve the proximity of neuronal cell bodies,”
J. Neural Eng., 8
(6), 066011
(2011). http://dx.doi.org/10.1088/1741-2560/8/6/066011 1741-2560 Google Scholar
C. M. George et al.,
“Implanted neural electrodes cause chronic, local inflammation that is correlated with local neurodegeneration,”
J. Neural Eng., 6
(5), 056003
(2009). http://dx.doi.org/10.1088/1741-2560/6/5/056003 1741-2560 Google Scholar
V. S. Polikov, P. A. Tresco and W. M. Reichert,
“Response of brain tissue to chronically implanted neural electrodes,”
J. Neurosci. Methods, 148
(1), 1
–18
(2005). http://dx.doi.org/10.1016/j.jneumeth.2005.08.015 JNMEDT 0165-0270 Google Scholar
K. A. Potter et al.,
“Curcumin-releasing mechanically adaptive intracortical implants improve the proximal neuronal density and blood-brain barrier stability,”
Acta Biomater., 10
(5), 2209
–2222
(2014). http://dx.doi.org/10.1016/j.actbio.2014.01.018 Google Scholar
T. R. Cox and J. T. Erler,
“Remodeling and homeostasis of the extracellular matrix: implications for fibrotic diseases and cancer,”
Dis. Models, 4
(2), 165
–178
(2011). http://dx.doi.org/10.1242/dmm.004077 Google Scholar
A. Lan et al.,
“Acidic extracellular pH shifts colorectal cancer cell death from apoptosis to necrosis upon exposure to propionate and acetate, major end-products of the human probiotic propionibacteria,”
Apoptosis, 12
(3), 573
–591
(2007). http://dx.doi.org/10.1007/s10495-006-0010-3 Google Scholar
Y. Kaneo et al.,
“Pharmacokinetics and biodisposition of poly (vinyl alcohol) in rats and mice,”
Drug Metab. Pharm., 20
(6), 435
–442
(2005). http://dx.doi.org/10.2133/dmpk.20.435 Google Scholar
M. J. Doughty,
“pH dependent spectral properties of sodium fluorescein ophthalmic solutions revisited,”
Ophthal. Physiol. Opt., 30
(2), 167
–174
(2010). http://dx.doi.org/10.1111/opo.2010.30.issue-2 OPOPD5 0275-5408 Google Scholar
R. Sjöback, J. Nygren and M. Kubista,
“Absorption and fluorescence properties of fluorescein,”
Spectrochim. Acta Part A, 51
(6), L7
–L21
(1995). http://dx.doi.org/10.1016/0584-8539(95)01421-P Google Scholar
S. T. Lee et al.,
“A sensitive fibre optic pH sensor using multiple sol–gel coatings,”
J. Opt. A, 3
(5), 355
–359
(2001). http://dx.doi.org/10.1088/1464-4258/3/5/307 JOAOF8 1464-4258 Google Scholar
S. Thomas Lee et al.,
“A microbent fiber optic pH sensor,”
Opt. Commun., 205
(4–6), 253
–256
(2002). http://dx.doi.org/10.1016/S0030-4018(02)01406-2 OPCOB8 0030-4018 Google Scholar
M. A. Khan et al.,
“A fiber optic pH sensor with 1-(2-pyridylazo)-2-naphthol doped in silica sol-gel film,”
Sens. Lett., 7
(1), 1
–5
(2009). http://dx.doi.org/10.1166/sl.2009.1001 Google Scholar
A. Stefani et al.,
“Dynamic characterization of polymer optical fibers,”
IEEE Sens. J., 12
(10), 3047
–3053
(2012). http://dx.doi.org/10.1109/JSEN.2012.2208951 ISJEAZ 1530-437X Google Scholar
S. Baseri, M. Karimi and M. Morshed,
“Effects of tension on mesomorphic transitions and mechanical properties of oriented poly (ethylene terephthalate) fibers under supercritical exposure,”
Polymer Bulletin., 70
(3), 953
–969
(2013). http://dx.doi.org/10.1007/s00289-012-0899-3 Google Scholar
BiographySean McMillan is a business development manager for engineered materials at PolyOne Corporation. He received his bachelor’s degrees in biology and chemistry at Radford University in 2012 and his master’s degree for materials science and engineering from Virginia Tech in 2016. Prior to his graduate degree, he worked for several years in research developing medical diagnostic kits for enteric diseases at TechLab, Inc. Chris Rader is a master’s student in materials science and engineering at Virginia Tech who received a bachelor’s in materials science and engineering in 2016. His research involves biomedical applications of nanostructured poly(ether ether ketone) for bone replacements under the supervision of Dr. E. Johan Foster. Mehdi Jorfi is a research fellow in the Center for Engineering in Medicine at Harvard Medical School and Massachusetts General Hospital. He has received several awards, including the honorary Faculty Science Prize in Experimental Sciences, the Swiss National Science Foundation postdoctoral fellowship, and the Swiss Academy of Sciences/Swiss Chemical Society Award. His research encompasses insights into materials science, biology, and engineering underpinning neuroscience-inspired bioengineering research, new concepts in biomaterials design and using micro/nanotechnologies toward neurological disorders. Gary Pickrell is a professor in MSE, Rolls Royce Commonwealth director, and associate director, Center for Photonics Technology, Virginia Tech. He has been honored as a SPIE Fellow, Rudolph A Marcus Award, Faculty Fellow 2007, outstanding assistant professor 2005, R&D 100 award 2004 and has over 200 publications (cited >2000 times), with 16 books, 4 special journal issues, 16 patents, has chaired ~ 25 international conferences, and has been PI/coPI on over $12 million in funded research. E. Johan Foster is an associate professor and the Digges Faculty Fellow in materials science and engineering at Virginia Tech. Johan’s main interests focus on design, synthesis, processing and investigation of functional nanocomposites, biomaterials, supramolecular materials and polymers. His research group continues to focus on the chemistry and engineering of functional bio (nano) materials, imbibing materials with “smart” functionality, often utilizing cellulose nanocrystals (CNCs) as a filler. |