|
|
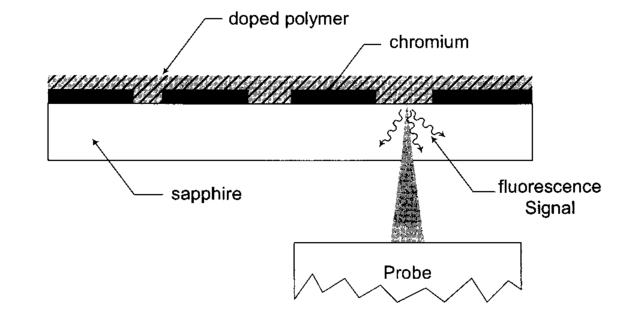
1.IntroductionFluorescence imaging is being more and more employed, especially since blue or near-UV sources are available.1 Indeed, most of the medical and biological applications exploit the red fluorescence of tissues illuminated with a blue or near-UV excitation light. Among the different applications of such imaging techniques, research concerning dermatology or cancer detection has been widely published.2 3 4 For example, the cells of the skin naturally produce protoporphyrin IX (PPIX). This molecule emits a 630-nm-wavelength fluorescence signal when it is excited at a wavelength of 410 nm. In the normal case, the amount of PPIX produced by the cells is relatively low. Conversely, when the cell is cancerous and if it is treated with aminolevulinic acid, a large quantity of PPIX is produced. Fluorescence imaging is therefore an efficient imaging technique for skin cancer detection. Up to now, fluorescence imaging methods were either based on quite expensive and complicated apparatuses [i.e., fluorescence confocal microscopes or microchannel plate (MCP)-intensified cameras], or simple and inexpensive devices having the drawback of a limited spatial resolution. For example, confocal microscopes have been used to image human cells with very good resolutions.5 However, measurements can principally be made on tissues that have been obtained by biopsies. To access in vivo investigations, MCP-intensified cameras can be employed.6 7 8 The best cameras are equipped with MCP photomultipliers in front of the sensitive area. In this case, it is possible to image living tissues as long as a suitable and powerful light source is employed. An alternative to these complicated techniques is to use local probes.9 10 11 However, the spatial resolution that can be achieved with these devices is still relatively low. In this paper, we propose a new approach to obtain high-spatial-resolution fluorescence images with a very simple device. For this purpose, an optical probe consisting of five optical fibers was developed. A central single-mode fiber with a 2-μm core diameter and a 125-μm cladding is surrounded by four step-index multimode fibers (400-μm core diameters and 430-μm cladding). The central fiber is single mode for the excitation wavelength around 400 nm. The multimode fibers, coupled to a photomultiplier, are used to collect the fluorescence signal. Part of the originality of the method consists of placing a graded-index (GRIN) lens (pitch 0.25 at 630 nm from Nippon Sheet Glass) in front of the fibers. Because of the relatively large chromatic dispersion of such a GRIN lens, the blue excitation light is efficiently focused on the sample surface, which ensures very good spatial resolution. At the same time, the red fluorescence signal is collimated by the GRIN lens so that a large amount of the fluorescence signal is launched back into the collecting fibers. The probe (fibers plus the GRIN lens) has a diameter of only 3 mm, and is inserted in a microscanning device that enables us to explore a surface with an 8-mm diameter. This specific arrangement enables both the detection of weak fluorescence signals (collimation of the red light) and the achievement of a high spatial resolution (focusing of the blue excitation light). However, the final spatial resolution of the probe also depends on the accuracy of the microscanning device, which must be adapted to the foreseen application. In what follows, we first present the probe itself and the experimental arrangement used for testing the device. Then we explain how we have evaluated the spatial resolution of the probe. More precisely, we detail the microphotolithographic process used to fabricate square fluorescent samples with sizes ranging from 4 μm to a few tens of micrometers. Finally, we present experimental fluorescence images of these samples showing the resolution of the probe, as well as images of a leaf that constitutes an example of results obtained with a biological tissue. 2.Probe Description and Experimental ArrangementFigure 1 shows the actual probe. As stated, it consists of five optical fibers. These fibers are attached together by means of a predrilled 2-mm-diam cylinder, which is fixed in a holder, enabling adjustment of the position of the GRIN lens with respect to the fibers ends. The central fiber has a 2.7-μm core diameter and is single mode for blue or near-UV light (around 400 nm wavelength). It is used to illuminate the region of interest. The GRIN lens focuses the excitation light onto the sample to be analyzed. The beam spot size at the output of this excitation fiber is approximately of 3 μm. It is therefore theoretically possible to illuminate a region of only 3 μm diameter, which provides a first idea of the resolution. Later, we show that the actual resolution is of the order of 5 μm. The working distance of the GRIN lens is chosen in such a way that a sapphire window can be inserted between the end face of the lens and the sample under test. Such a window is required for different reasons. It is a protection for the GRIN lens and the attached fibers. It also enables us to maintain the working distance constant (i.e., the spot size and the resolution). At the same time, it flattens the sample, which is of importance to keep the working distance constant all over the scanned area. Also, sapphire is used because of its biocompatibility and for the fact that it is transparent for both excitation and fluorescence wavelengths. The fluorescence signal (around 630 nm wavelength) is collected by the four multimode fibers attached around the excitation fiber (core diameter of 400 μm). The GRIN lens is also chosen to roughly collimate the fluorescence signal. These collecting fibers are assembled in the same SMA connector. The latter is placed in front of a Hamamatsu photomultiplier (PM H7711-03). Between the SMA connector and the PM, we place an interference filter to reject any unwanted signal. Of course, the filter must be chosen to function for the specific application envisaged. Tests have shown that no spurious fluorescence due to the fibers results from excitation at wavelengths larger than 350 nm. Note that the expoxy glue used to attach the fibers together was also chosen so as to exhibit a minimum of unwanted fluorescence around 630 nm. Figure 2 shows the experimental arrangement. A blue laser diode (GaN, emission wavelength 405 nm) is directly driven with a 4-kHz transistor-transistor logic (TTL) signal issued from a PC. This driving voltage is simultaneously applied to one input of a lock-in amplifier. Note that no function generator is required. The second input of the lock-in is fed with the fluorescence signal delivered by the PM. The selectively amplified fluorescence signal is then processed with the PC. The latter is also used to drive the scanning devices (not shown in the figure) and to synchronize the motion of the probe and the acquisition of the images. 3.Sample PreparationTo test the resolution of the probe, we fabricated microfluorescence samples. They consist of a series of fluorescent squares whose sizes range from 4 μm to a few tens of micrometers. To this end, we used the techniques of microphotolithography. All the operations were carried out in a clean room. First, a thin Cr layer (about 100 nm) was vacuum deposited on a sapphire plate. The plate was then spin coated with a layer of thin photoresist. A photolithographic mask was used to define the square samples. Figure 3 shows a picture of the mask used for this operation. It is composed of different areas with collections of squares. The right part of the figure is a magnified view of the 10-μm squares. The photoresist is UV illuminated through the mask, and the Cr layer is etched so that apertures reproducing the mask are opened in the Cr layer. Figure 4 shows the final sample together with the probe. A polymer (PMMA) is doped with a fluorophore and deposited above the Cr mask. Therefore, the sapphire plate acts as a mask through which fluorescence can be observed. The small aperture enables the spatial resolution to be evaluated. However, the Cr layer strongly reflects the exciting light, which induces a spurious fluorescence in the GRIN lens and in the expoxy glue used to attach the fibers together. This constant fluorescence noise reduces the signal-to-noise ratio (SNR). This is one of the factors limiting the final resolution of the images. Of course, this problem becomes negligible in the case of an application with real biological tissues which are much less reflective than metallic layers. Figure 3Microscope view of the mask used to fabricate the fluorescent microsamples. The size of the squares ranges from 4 μm to a few tens of micrometers. The enlarged part corresponds to the 10-μm pattern.  The fluorophore used to dope the PMMA is the PPIX. The polymer was spin coated directly onto the Cr pattern. A few-micrometer-thick PMMA layer was obtained with a concentration in PPIX of about 1 wt. We did not choose this substance only because of its fluorescence properties. PPIX exhibits fluorescence around 630 nm when excited at 405 nm. Indeed, we chose the PPIX because of its medical properties as already stated. Note also that PPIX is not only a detector for malignant cells; it is also a photosensitive agent that can be used for phototherapy. Early detection of skin cancer is one of the applications we plan to study with our probe. This is the reason why we used this specific fluorophore. Here, the samples can be regarded as a simulation of the skin cells where some of them are malignant. 4.Experimental ResultsThe probe was used to experiment with the described samples. One difficulty we encountered was the adjustment of the distance between the output face of the GRIN lens and the samples (i.e., the working distance). As previously mentioned, the working distance dictates the excitation beam spot size. To achieve the best resolution it is necessary to focus the beam on the sample surface. Unfortunately, when the beam is correctly focused, only a few of the fluorescence emitting centers are excited. This leads to a very weak signal that is extremely difficult to detect even using the lock-in amplifier. Figure 5 illustrates schematically what happens when the probe is brought near to the sample surface. When the probe is far away (about 1 mm), the excitation beam is not powerful enough to induce a sufficient amount of fluorescence signal. While the probe is approaching the surface, the fluorescence signal begins to increase and reaches a maximum (at about 750 μm from the surface). At the same time the diameter of the excitation beam decreases while its power density increases. The focal point is met when we further reduce the working distance (between 750 and 500 μm). Here, despite the fact that the excitation power density increases, the number of emitting centers decreases, which explains the observed reduction of the collected fluorescence signal. The minimum occurs when the spot is completely focused on the sample. Indeed, the signal observed at the focal point is mainly due to the reflection of the excitation light from the Cr surface (see Sec. 3). If we continue to reduce the working distance, the spot size begins to increase again, and the number of emitting centers also increases, so that the fluorescence signal rises to another maximum (around 300 μm). This highlights the fact that the working distance is a key point of our system, not only for the spatial resolution of the images, but also for their SNRs. Figure 5Evolution of the collected fluorescence intensity when the probe approaches the sample surface.  The best resolution should be achieved when working at the focal point of the GRIN lens. However, as shown in Fig. 5, it also corresponds to the weakest signal. A compromise must be found between the resolution and an acceptable SNR. The blue laser diode used in this experiment produces 1 mW at a 405-nm wavelength at the output of the excitation fiber. With these conditions, it was possible to work very close to the focal point and to achieve micrometric resolutions. In Fig. 5, we note the range of working distances we used (around 550 μm). Figure 6 shows images obtained with the micromachined samples described in Sec. 3. The mask pattern can easily be recognized. Figure 6(a) corresponds to the 20-μm pattern. The overall image size is 250×250 pixels with a pixel size of 1×1 μm2. Figure 6(b) represents the 10-μm pattern. Again, the pixel size is 1×1 μm2, but the image size is now 110×110 pixels. In this case, the 10×10-μm squares are efficiently resolved, and the resolution is about 5 μm. We can observe that the SNR in Fig. 6(b) is lower than the SNR in Fig. 6(a). This is due to the reduced number of fluorescence emitting centers in Fig. 6(b). Attempts were made to form images of the 5×5-μm pattern, but the SNR was too low for the image to be relevant. Indeed, when considering such small areas, the intensity of fluorescence issued from the sample is of the same order as the spurious signal due to the reflection of the excitation light from the Cr layer. Figure 6Experimental images of the fluorescence microsamples: (a) view of the 20-μm pattern (250×250 pixels, pixel=1 μm2) and (b) view of the 10-μm pattern (110×110 pixels, pixel=1 μm2).  Figure 7 presents images obtained with leaves. In this case, the fluorescence signal is not produced by the PPIX, but by the A type chlorophyll contained in the leaves. Because the fluorescence spectrum is centred around 680 nm, the interference filter was changed.12 In the figure, the left-hand column corresponds to direct intensity images, while the right-hand column shows fluorescence images. In the same way, the top row corresponds to large views of the leaf (200×200 pixels for an area of 1 cm2), while the bottom row represents close images of smaller areas (100×100 pixels for an area of 1 mm2). Relatively fine structures of the leaves can easily be observed. In these pictures, the spurious fluorescence signal due to the reflection from the Cr layer does not exist. Therefore, the SNR must be better than in the case of Fig. 6(b), even if it is difficult to evaluate it directly from the figure. Indeed, there are not enough details to be seen on the close fluorescence image because the chlorophyll is present almost everywhere in the leaf. This makes the fine structure not directly observable. However, one can observe a highly fluorescent area, which is not visible on the direct intensity image. Figure 7Experimental images of a leaf. The left column corresponds to direct intensity images, while the right column shows fluorescence images. The top row presents large views of the leaf, while the bottom one corresponds to close views. The large fluorescence image has a surface of 1 cm2 and the close view shows an area of 1 mm2.  The scanning speed is an important issue that must be discussed. The scanning device used for Fig. 6 is a step-by-step motor driven with 1-μm resolution. These reduced scanning steps lead to relatively long acquisition times. For example, 15 min were required to obtain the images presented in Fig. 6. In a slightly different manner, continuous current motors were experimented with. The signal processing is more complicated as it involves oversampling and decorrelation operations. However, in this case, scanning speeds of the order of 6 s/line (i.e., 30 ms per pixel) was achieved. Faster scanning may be obtained with these motors, but we did not try to determine the speed limit of those devices. Instead, we began to develop a new prototype, shown in Fig. 8, devoted to in vivo and early detection of skin cancers at the scale of a unique cell. In this device, the probe is contained inside the cylinder that can be seen in the figure. The probe is rapidly driven by means of micromachined actuators. The device is terminated by a sapphire window in direct contact with the patient skin. With this system, less than 1 min should be required to scan an area of 50 mm2. 5.ConclusionWe presented a new fluorescence imaging probe with a high spatial resolution. Fluorescence images of microsamples showed a spatial resolution of about 5 μm. This probe can be used in a wide range of biological or medical applications. The resolution is high enough to enable measurements at the single cell level. Moreover, various types of analysis can potentially be undertaken. For example, the probe can be employed to obtain an image at a fixed fluorescence wavelength (use of an interference filter), or it can be used for spectroscopic analysis. This can be achieved by inserting a spectrometer between the SMA collecting connector and the PM. An aspect that has not yet been mentioned is that the fluorescence measurement is based on the intensity detected by the PM. This makes the system sensitive to any intensity variation of the laser diode itself. That is the reason why we are now studying an analysis technique based on the fluorescence lifetime by means of a modulated PM. At the same time, we are working on the improvement of the scanning speed and on the development of a new device devoted to skin cancer detection at the cell scale. New experimental results concerning this aspect should be available soon. To conclude, note that since the blue or near-UV excitation light is focused onto the patient skin, and since the cells are pretreated with a photosensitive agent, the probe can potentially be used not only for cell-scale cancer detection, but also for instantaneous phototherapy. Indeed, while the explored zone is analyzed, a powerful UV probe can be applied as soon as a malignant cell is detected. Diagnosis and therapy could then be conducted simultaneously. REFERENCES
N. M. Johnson
,
A. V. Nurmikko
, and
S. P. DenBaars
,
“Blue diode lasers,”
Phys. Today , 31
(9), 31
–36
(2000). Google Scholar
S. Andersson-Engels
,
G. Canti
, and
R. Cubeddu
,
“Preliminary evaluation of two fluorescence imaging methods for detection and delineation of basal cell carcinomas of the skin,”
Lasers Surg. Med. , 26
(1), 76
–82
(2000). Google Scholar
S. Andersson-Engels
,
C. Klinteberg
,
K. Svanberg
, and
S. Svanberg
,
“In vivo fluorescence imaging for tissue diagnostics,”
Phys. Med. Biol. , 4
(2), 815
–824
(1997). Google Scholar
J. Hewett
,
T. Mckecnie
,
W. Sibbett
, and
J. Ferguson
,
“Fluorescence detection of superficial skin cancer,”
J. Mod. Opt. , 47 2021
–2027
(2000). Google Scholar
J. M. Girkin
and
A. I. Ferguson
,
“Confocal microscopy using an InGaN violet laser diode at 406 nm,”
Opt. Express , 7
(10), 336
–341
(2000). Google Scholar
S. Andersson-Engles
,
R. Berg
,
K. Svanberg
, and
S. Svanberg
,
“Multi-colour fluorescence imaging in connection with photodynamic therapy of δ-aminolevulinic acid (ALA) sensitised skin malignancies,”
Bioimaging , 3 134
–143
(1995). Google Scholar
K. Svanberg
,
I. Wang
,
S. Colleen
, and
I. Idvall
,
“Clinical multi-colour fluorescence imaging of malignant tumours—initial experience,”
Acta Radiol. , 39 2
–9
(1998). Google Scholar
A.-M. Wennberg
,
F. Gudmundson
,
B. Stenquist
,
A. Ternesten
,
L. Mo¨lne
,
A. Rose´n
, and
O. Larko¨
,
“In vivo detection of basal cell carcinoma using imaging spectroscopy,”
Acta Derm Venereol. , 79 54
–61
(1999). Google Scholar
K. Ko¨nig
,
A. Ru^ck
, and
H. Shneckenburger
,
“Fluorescence detection and photodynamic activity of endogenous protoporphyrin in human skin,”
Opt. Eng. , 31
(7), 1470
–1474
(1992). Google Scholar
H. Zeng
,
C. MacAulay
,
D. I. McLean
, and
B. Palcic
,
“Novel microspectrophotometer and its biomedical applications,”
Opt. Eng. , 32
(8), 1809
–1813
(1993). Google Scholar
J. Hewett
,
V. Nadeau
, and
J. Ferguson
,
“The application of a compact multispectral imaging system with integrated excitation source to in vivo monitoring of fluorescence during topical photodynamic therapy of superficial skin cancers,”
Photochem. Photobiol. , 73
(3), 278
(2001). Google Scholar
M. S. Kim
,
J. E. McMurtrey
,
C. L. Mulchi
,
C. S. T. Daughtry
,
A. W. Chappelle
, and
Y. R. Chen
,
“Steady-state multispectral fluorescence imaging system for plant leaves,”
Appl. Opt. , 40
(1), 157
–166
(2001). Google Scholar
|