|
|
1.IntroductionFluorescence is the physical phenomenon in which light is emitted by a substance as a result of excited electrons returning to their ground states after absorption of excitation light. Biological tissues contain several endogenous fluorophores such as nicotinamide adenine dinucleotide (NADH), aromatic amino acids such as tryptophan, and structural proteins including collagen and elastin.1 The optical properties of these fluorophores respond to the environment and metabolic status of the tissue, thus making fluorescence spectroscopy a valuable tool to study the state of biological tissues. Fluorescence spectroscopy consists of measuring the fluorescent intensity emitted by fluorophores after being excited by light at a suitable wavelength and can be performed in either a steady-state or a time-resolved manner. Steady-state measurements typically involve measuring either the fluorescence intensity over a range of wavelengths for a fixed excitation wavelength (emission spectra) or the fluorescence intensity at a particular wavelength for a range of excitation wavelengths (excitation spectra). Time-resolved measurements consist of measuring the lifetime of the fluorophores and are much more complex than steady-state spectral measurements due, in part, to the instrumentation required. Steady-state measurements are relatively easy to perform. However, they present some limitations. First, they are intensity dependent and therefore are sensitive to excitation light intensity, optical losses in the experimental setup, and absorption and scattering by tissue.2 Second, the fluorescence intensity is integrated over time and, therefore, information associated with the dynamics of the fluorescence process is lost. Time-resolved measurements, on the other hand, capture the transient decay, which depends on the relative concentrations and lifetimes of the fluorophores contributing to the fluorescence signal.2 They are also extremely sensitive to the local biochemical environment such as the pH and oxygenation, which may differ in healthy and diseased tissue.2 In addition, the fluorophore lifetimes are independent of absolute intensity and so do not change with variations in excitation intensity or optical losses from hemoglobin absorption.2 Finally, fluorescence lifetime measurements enable the discrimination of fluorophores with overlapping emission spectra but different lifetimes.3 For example, various tryptophan residues in proteins have similar emission spectra but different lifetimes and thus can be distinguished by time-resolved fluorescence measurements.4 Time-resolved fluorescence techniques can be performed in either the frequency domain or the time domain.4 Frequency-domain techniques involve exciting the sample with a sinusoidally modulated source, which could be a continuous wave laser or a flash lamp, and measuring4 the phase shift of the emitted light at multiple excitation frequencies to compute the fluorescence lifetime(s). Alternatively, time-domain measurements typically use ultrashort pulsed light to excite the sample and measure the emitted fluorescence as a function of time, thus enabling one to compute the lifetime of the fluorophore. Note that the pulse width must be of the same order of magnitude as or shorter than the fluorescence lifetime. Time-domain measurements are preferred in a clinical setting, because they can be obtained in short acquisition times compared to frequency-domain measurements3 and they are not affected by ambient light at the collection site.3 The detection of the diabetic state has become an important issue recently as the number of people with diabetes is rising and approximately one-third of people affected by type 2 diabetes in the United States are undiagnosed.5 The current methods of diagnosis consist of detecting glucose levels in the blood or plasma.6 Even with screening, the sensitivity is much less than ideal.7 Once diabetes has been diagnosed, glucose levels and hemoglobin A1c (HbA1c) are currently utilized to follow the efficacy of treatment. The latter is a measure of percent glycated hemoglobin and reflects average glycemic control over the antecedent 3 to 4 months.8 As a test of short-term glycation, HbA1c does not adequately reflect the accumulation of glycated tissue over a period of years, which may result in diabetic complications. To directly measure tissue glycation, a punch biopsy must be taken,9 making it difficult to determine a patient’s risk for complications. Thus, a simple, rapid method of screening is being pursued to enable early diagnosis of the disease and to follow the efficacy of therapy and the effects of long-term hyperglycemia on tissue. Spectroscopy-based methods are attractive for diabetes screening and monitoring because they can noninvasively detect some markers of disease progression. For example, the accumulation of advanced glycation end-products (AGEs) in tissue can potentially be observed via spectroscopy. AGEs are the final products of the complex chemical reaction, known as the Maillard reaction, between sugars such as glucose and proteins, lipids, and nucleic acids.9 While the accumulation of these in tissues is a natural process and serves as a marker of aging,10 elevated blood glucose levels in diabetic individuals results in a more rapid accumulation of AGEs. Some AGEs, such as pentosidine, are known to fluoresce and their fluorescence spectra are well characterized.11 It has also been established that the steady-state autofluorescence of skin is correlated with age.10 Additionally, the formation of these AGEs produces structural changes in tissue proteins, such as collagen,12 which can be detected through spectroscopy measurements.13 This study evaluated the use of a time-resolved fluorescence device using time-correlated single-photon counting (TCSPC) on in vivo human skin to screen for type 2 diabetes. An additional goal of this study was to evaluate the use of the time-resolved fluorescence device to assess a patient’s risk for complications based on changes in skin fluorescence caused by AGE formation. Preliminary experiments were performed on the palms, arms, feet, and cheeks of a 31-year-old Caucasian subject to observe measurement variability due to testing location. The device was tested on 37 healthy and 38 diabetic subjects of different age, gender, and skin, complexion after obtaining informed consent and approval from University of California, Los Angeles (UCLA) and Veteran’s Administration (VA) institutional review boards. The study refers to “healthy subjects” as those who are not known to be diabetic, and “diabetic subjects” as those who have been diagnosed with diabetes. Variability in recovered time-resolved fluorescence parameters due to age, skin color, and gender was also tested. Also, 18 diabetic subjects with foot ulcers were compared with 18 age-matched healthy subjects to test for differences due to the development of complications. Finally, the possible origin of these fluorescence lifetimes is discussed. This is the first study to report the application of time-resolved fluorescence to the detection of diabetes and/or monitoring for the development of diabetic complications. This work is of particular importance to studies on skin autofluorescence measurements for noninvasive glucose sensing14 and the design of implantable glucose sensors based on fluorescence.15 It would also serve as a baseline for using time-resolved autofluorescence of human skin to monitor other diseases and conditions such as skin cancer, wounds, and ulcers. 2.Current State of Knowledge2.1.Time-Resolved Fluorescence Measurements on TissueIn vivo time-resolved fluorescence measurements have come into prominence only recently and a limited number of studies have been reported in the literature, which is summarized in Table 1 . For example, Pradhan 16 used fluorescence lifetime measurements to study breast tissue. They made use of laser pulses of pulse width at and a streak camera to obtain a 2-D map of the fluorescence lifetimes. It was shown that time-resolved fluorescence measurements at an emission wavelength around can be used to distinguish malignant tumors from nonmalignant breast tissues. Table 1Experimental studies of time-resolved fluorescence spectroscopy on human tissues.
Fluorescence lifetime measurements have also been used to study tissue during endoscopy. Glanzmann 17 described a time-resolved fluorescence instrument based on pumped laser excitation sources and a streak camera coupled to a spectrograph as a detector. The instrument was used to measure the fluorescence decays of endogenous fluorophores and of -aminolevulinic acid (ALA)-induced protoporphyrin IX (PPIX) in an excised human bladder with carcinoma. The authors were able to correctly distinguish healthy tissue, which appeared abnormal in steady-state spectroscopy, from cancerous tissue. The instrument was then used to perform in situ characterization during endoscopy to obtain time-resolved spectra of tissue fluorescence of human bladder, bronchi, and esophagus.18 Further studies were conducted by the same group19 to test the viability of fluorescence lifetime as a new contrast parameter between normal and malignant tissue in the bronchi. However, they were unable to obtain a contrast in the fluorescence lifetime or the spectrum between normal and moderately dysplastic tissue in the spectral region between 510 and . Mizeret 20 also studied the feasibility of performing endoscopic fluorescence lifetime measurements using frequency modulation techniques in real time in a clinical setting. The instrument made use of an excitation source at and a detection unit consisting of CCD units with image intensifier tubes. Fluorescence lifetime values for healthy bronchial tissue were reported. Pfefer 21 also performed in vivo fluorescence lifetime and spectral measurements on patients undergoing routine endoscopic surveillance for Barrett’s esophagus. A time-domain instrument consisting of a laser pulsing at with a pulse width of and an APD coupled to an oscilloscope was used in the experiments. The excitation wavelengths used were 337 and and the emission was collected around . Results showed that low-risk tissue and high-grade dysplasia could not be differentiated based on the observed data. Furthermore, Schweitzer 22, 23 performed fluorescence lifetime studies on the human ocular fundus. They made use of TCSPC techniques with a pulsed laser of 300-ps pulse width at a wavelength of and various emission wavelength ranges. They obtained a lifetime of in the parapapillary region of the eye and a lifetime of in the optical disc, which they attributed to collagen. They also showed that breathing 100% oxygen affects the fluorescence lifetimes and speculated that the lifetime of fluorophores present in the retinal pigment epithelium depends on the oxygen supply. Fluorescence lifetime measurements have also been performed on tissue in vitro. For example, Maarek 25 used time-domain in vitro fluorescence lifetime measurements and spectroscopy for diagnosis of atherosclerotic lesions. The instrument consisted of an excitation laser at and a pulse width of , a microchannel plate photomultiplier attached to a monochromator and connected to a digital oscilloscope. Fluorescence lifetimes were measured at emission wavelengths ranging from 370 to . The authors were able to discriminate between stable and unstable lesions by studying the time-resolved spectra of components present in the arterial wall, namely, structural proteins such as collagen, lipoproteins, and cholesterol.26 Moreover, Cubeddu 27, 28 used fluorescence lifetime imaging (FLIM) to study tumors in human skin. The instrumentation consisted of a dye laser pulsing at at a pulse width of less than and a gated imaging system. An exogeneous marker was used to induce selective accumulation of PPIX in proliferative tissue. Tumors were identified using lifetime imaging due to the longer fluorescence lifetime of PPIX compared to that of healthy tissue . Siegel 29 also used FLIM techniques, utilizing a pulsed laser at and a pulse width less than and a gated optical intensifier to image the autofluorescence from various biological tissue in vitro, such as animal tissue, knee joints, and human teeth. Using this instrument they were able to distinguish between tendon, bone, and surrounding tissue, which was not otherwise possible with white light and steady-state fluorescence measurements. Similarly, they showed that various regions in an extracted human tooth can be clearly distinguished using FLIM unlike reflectance and steady-state fluorescence measurements. Other studies have performed time-resolved fluorescence measurements on human skin. Konig, 30 Konid and Riemann,31 and Riemann 32 used 3-D autofluorescence lifetime imaging and investigated various tissues of patients with psoriasis, nevi, dermatitis, basalioma, and melanoma in vitro as well as the skin of healthy subjects in vivo. Their system was able to achieve a subcellular spatial resolution and a temporal resolution of . The authors analyzed the fluorescence decays from images obtained at various depths of the skin and reported lifetimes of around at the stratum corneum and a lifetime of about at a depth of within the stratum spinosum. The same group also reported using multiphoton imaging of skin at an excitation wavelength of with a 150-ps resolution.33 A biexponential fit was used to recover a fast lifetime of and a slow lifetime of at the stratum spinosum in the epidermis. Additionally, Pitts and Mycek2 described a time-domain instrument with both spectral and temporal resolution to measure fluorescence lifetimes and emission spectrum in vivo and in vitro. The instrument was based on a pumped dye laser with a pulse width of as an excitation source and an APD along with a 1-GHz oscilloscope as a detector. Fluorescence lifetime measurements were performed on human skin in vivo at an excitation wavelength of and an emission wavelength of . The time-resolved data were fit to a double-exponential decay, yielding lifetimes of 0.938 and . The longer lifetime was attributed to the emission from collagen. The instrument was also used to measure fluorescence lifetimes of biomolecules present in human cells. 2.2.Optical Noninvasive Screening of Type 2 DiabetesA few groups have applied spectroscopic studies to the noninvasive screening of type 2 diabetes. For example, Meerwaldt 34 observed steady-state autofluorescence measurements of skin on the arm and lower leg of both diabetic and healthy subjects. Diabetic and healthy subjects were age- and sex-matched. Using excitation spectrum between 300 and and emission spectrum between 420 and , they found a positive correlation between skin autofluorescence intensity with age, diabetes duration, and mean HbA1c levels from the previous year. The fluorescence intensity also correlated well with the concentrations of AGEs in tissue biopsies, such as pentosidine and carboxymethyllysine. This demonstrated the capability of steady-state fluorescence measurements to distinguish diabetics from healthy subjects. The study’s primary focus was monitoring disease progression and evaluating the patient’s risk for diabetic complications. In a later study, the same group showed that autofluorescence also correlated with severity of diabetic neuropathy35 and vascular damage in type 2 diabetic subjects.36 However, the effect of skin color was not addressed in these studies as nearly all subjects recruited were Caucasian. In fact, the researchers reported that data from dark-skinned subjects had to be discarded, because of nearly complete absorption of excitation light by the skin.36 Otherwise, the steady-state measurements must be adjusted to account for skin complexion. Brown 37 clinically evaluated the use of a near-IR (NIR) spectroscopic device for its ability to correctly identify diabetic and nondiabetic subjects. The NIR wavelength region under observation in the study was from 1250 to . The diffusely reflected radiation was collected and the tissue absorbance was retrieved. Data from both diabetic and healthy subjects were collected and the device was found to have a sensitivity and specificity of 77.7 and 70%, respectively. Thus, this system’s sensitivity and specificity are comparable to the fasting plasma glucose (FPG) test. Although a definite chemical or physiological explanation for the difference between diabetic and nondiabetic patients is yet to be elucidated, they speculate that structural changes in skin due to chronic hyperglycemia contribute to the differentiation between diabetic and nondiabetic subjects. However, the same group’s previous work38 suggested that NIR spectroscopy does not detect AGEs directly. Recently, Maynard 39 reported using a spectroscopic device for type 2 diabetes screening utilizing steady-state fluorescence as well as diffuse reflectance measurements. The fiber optic probe illuminated skin from the forearm of subjects using LED lights centered at 375, 405, 420, 435, and . A spectrometer and CCD array then collected the light reflected and/or emitted from the skin and detected it. The spectra were corrected for skin pigmentation, hemoglobin content, and light scattering as well as age to obtain an “intrinsic” dermal fluorescence spectra. These data were then used to determine a likelihood that a subject belonged to the abnormal class, or that they were either prediabetic or diabetic. This method of screening was compared to the FPG test and A1C testing. Assuming a clinically relevant specificity of 77.4%, their method showed a sensitivity advantage of 28.8 and 17.1% versus FPG and A1C testing, respectively. The group also reported that the sensitivity of their device was not significantly different between subjects of lighter skin and those with of darker skin. Thus, their study demonstrates the promise of steady-state fluorescence for type 2 diabetes screening if factors such as skin color and age can be adjusted for in measurements. Time-resolved fluorescence may hold promise in diabetes detection by distinguishing different fluorophores emitting at the same wavelength and potentially being able to detect AGEs directly. 3.Materials and Methods3.1.Experimental ApparatusThe study reported here made use of the TCSPC technique to measure fluorescence lifetimes of skin. A schematic of the experimental setup is shown in Fig. 1 . Excitation and emission light were channeled by means of liquid light guides attached to a sensing head. Liquid light guides were used instead of commonly used fiber optics as their transmission and coupling efficiency are higher compared with fiber optics. Both light guides had a diameter of , and the excitation light guide was held above the skin. The receiving end of the collection liquid light guide was held abut against the excitation liquid light guide and angled at to the normal. The sensing head also served to shield the sample surface from ambient light. A total surface area of was exposed to excitation light. Fig. 1Schematic of the experimental setup, including (1) diode driver, (2) LED, (3) UV liquid light guide, (4) sample probe, (5) visible liquid light guide, (6) monochromator, (7) photomultiplier tube, and (8) personal computer. 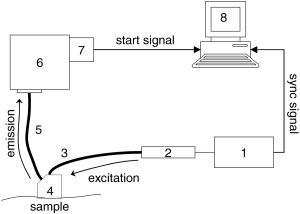 The excitation source used was a light emitting diode or LED (PLS 370 diode, PicoQuant GmbH) with its center wavelength at with a spectral width of around . The full width half maximum of the diode pulses at a repetition rate of and average power of per pulse was . The LED was driven by a diode driver (PDL-800 B diode driver, PicoQuant GmbH, Berlin, Germany) at a repetition rate of for all measurements, producing an estimated energy fluence rate of at the skin surface for a pulse energy of and pulse width of . A liquid light guide designed for the UV to visible part of the spectrum (77628, from Spectra-Physics, U.S.A) carried light from the LED to the sensing head. Another liquid light guide designed for the visible part of the spectrum (77631, from Spectra-Physics, U.S.A), was used to collect the fluorescence emission and carry it to a monochromator (SpectraPro-150, Acton Research Corporation, U.S.A.). A photomultiplier tube (PMT) assembly (PMA-M 165 from PicoQuant GmbH) was coupled to the monochromator on the other end. The monochromator slits on the entry and exit of the light path were adjusted manually to maintain a bandwidth of . Finally, for data acquisition, the “sync” output signal from the diode driver and the “start” signal from the PMT assembly were fed to the respective channels on the data acquisition board (TimeHarp 200 from PicoQuant GmbH), via standard coaxial cables. The “sync” output from the diode driver provided the signal to synchronize the timing electronics on the data acquisition board mounted on a personal computer (PC). The time resolution of our device was estimated to be . 3.2.Experimental Procedure and ParametersThe measurement procedure and parameters were arrived at by conducting preliminary studies on the palms, arms, cheeks, and feet of a 31-yr-old male Caucasian subject. The fluorescence lifetimes were measured at four different emission wavelengths: 442, 460, 478, and . The first wavelength was chosen based on studies reporting that collagen fluorescence exhibited a maximum at around when excited by light at , corresponding to collagenase-digestible collagen cross-links, including AGEs on collagen.40 The remaining wavelengths were arbitrarily chosen to cover the spectral range up to . To measure the fluorescence lifetimes, the monochromator was set to the emission wavelength of interest and the monochromator slits were adjusted to match that particular wavelength. The probe was then placed on the skin surface and the LED was turned on. The PMT shutter was opened once the sensing head was firmly placed on the skin surface and then the histograms were collected using the TimeHarp software. The probe was held in contact with the palm until 1500 to 5000 counts were acquired in the peak channel. This number was arrived at by considering a trade-off between the duration of the experiments and the signal-to-noise ratio. The duration of a single measurement ranged from 5 to , based on the sensing location and emission wavelength. It was observed that the time taken for each measurement was shortest on the palm, possibly due to the low concentration of melanin. Moreover, higher emission wavelengths required longer durations to achieve these counts due to a lower intensity of the fluorescence. Figure 2 shows a typical sample of in vivo time-resolved fluorescence measurement on human skin along with the and associated residuals indicating the goodness of the fit. For an acceptable fit, the must be around 1.0 and the residuals should be randomly distributed around 0. Fig. 2Typical measurement of fluorescence decay from human skin (dark gray), IRF (light gray), and exponential decay retrieved from reconvolution (black line) with the TimeHarp Fluofit 4.0 software package.  The instrument response function (IRF) was measured by placing the probe on a Teflon block for the same number of maximum photon counts of at least 1500 as in the in vivo measurements, with the PMT collecting at . The reconvolution software FluoFit version 4.0 was used to recover the lifetimes from the measured fluorescence decays. This software utilized the Marquardt-Levenberg algorithm with a weighting factor defined as where is the number of counts contained in channel . An attempt was made to describe the decays with a single-exponential, a biexponential, and a triexponential model. Only the biexponential and the triexponential models gave a value of around 1.0, which indicated a good fit. However, the biexponential model was rejected in favor of the more complicated triexponential model due to the presence of oscillations in the plot of the residuals compared to more random residuals for the triexponential model, as illustrated in Fig. 2. Thus, the fluorescence decay could be modeled aswhere and are the fractional amplitude and lifetime, respectively, for decay . Additionally, note that initial guess lifetimes were entered to enable faster convergence. A total of 75 subjects participated in this study. The population characteristics for all subjects are shown in Table 2 . The palms were chosen as the sensing location for these subjects due to the shorter duration of the experiments as well as ease of access. The first measurement at was performed on the left palm and subsequent measurements at higher wavelengths were performed alternately on the right and left palms.Table 2Population characteristics of healthy and diabetic subjects recruited for this study.
In addition to time-resolved fluorescence measurements, mean HbA1c values from the previous were recorded for diabetic subjects by obtaining medical records with Institutional Review Board (IRB) approved consent (UCLA IRB #04-12-012-02). Subjects were also recruited from the local VA hospital with VA hospital IRB approved consent (VA IRB #PCC 2005-030449). All consent forms were signed prior to testing and collection of medical record data. All available data for each subject from the previous year were averaged and two subsets of these data were compared, one with “high” average HbA1c values and the other with “low” average HbA1c values. Data on duration of diabetes were obtained directly from the subject being tested. 4.Results and DiscussionTable 3 presents a statistical summary of lifetimes , , and and the corresponding fractional amplitudes , , and for six measurements on the left palm of the same healthy subject at an emission wavelength of . These experiments were performed over a period of 1 month at different times of the day. The coefficient of variation, which represents the variation in measurements, is less than 5% in all cases except for the parameters and , for which it reaches 7 and 15%, respectively. This shows that measurements performed with this device are highly reproducible for a single subject. Additionally, six consecutive measurements, each lasting , were performed on the same hand within an hour. No noticeable changes in lifetimes, fractional amplitudes, or acquisition times were measured, suggesting that photobleaching was not induced during the measurements. Table 3Statistics of fluorescence lifetimes and their corresponding amplitudes obtained from six measurements on the left palm of a 31-year-old healthy Caucasian male subject at an excitation and an emission wavelength of 375 and 442nm , respectively.
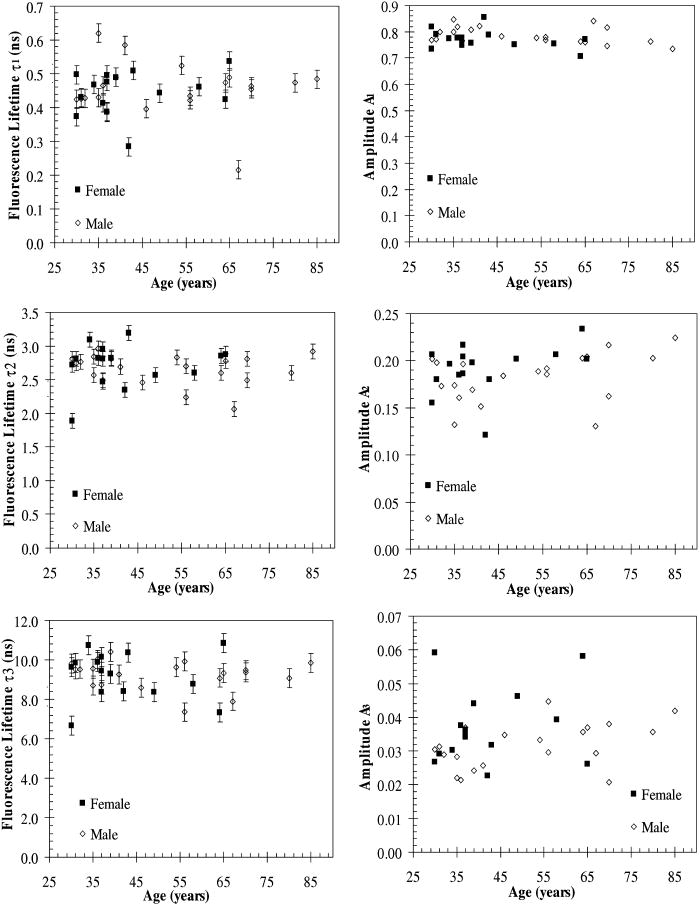
A set of three experiments were also performed on the inner arm of the same subject over the same period of time and at an emission wavelength of . Then, the Student’s -test41 was used to test differences in the fluorescence lifetimes obtained on the arm and the palm for this subject. A two-sample -test assuming unequal variances was performed. In all cases, a level of significance of was used. It was found that there were no significant differences in the fluorescence lifetime . However, the -test seemed to indicate that there was a difference in the fluorescence lifetimes and obtained on the arm and the palm at an emission wavelength of . Finally, a measurement was also taken on the cheeks and the feet of the same subject. Figure 3 shows the fluorescence lifetimes , , and and their corresponding fractional amplitudes , , and obtained as a function of emission wavelength and sensing location, namely, the palms, the arms, the cheeks, and the feet. The error bars in the plots of the fluorescence lifetimes represent asymptotic standard errors in the fluorescence lifetimes obtained using the Fluofit software package. Figure 3 indicates that the variations in the lifetimes from one location to another are minimal except on the cheek. Moreover, it was found in the course of the measurements that the time taken for each measurement was the least on the palm, possibly due to the low concentration of melanin. Therefore, the palm was chosen as the sensing location for all the other subjects. Fig. 3Effect of sensing location on fluorescence lifetimes , , and and fractional amplitudes , , and as a function of emission wavelength for a 31-yr-old Causcasian male subject at excitation wavelength of 375 nm. 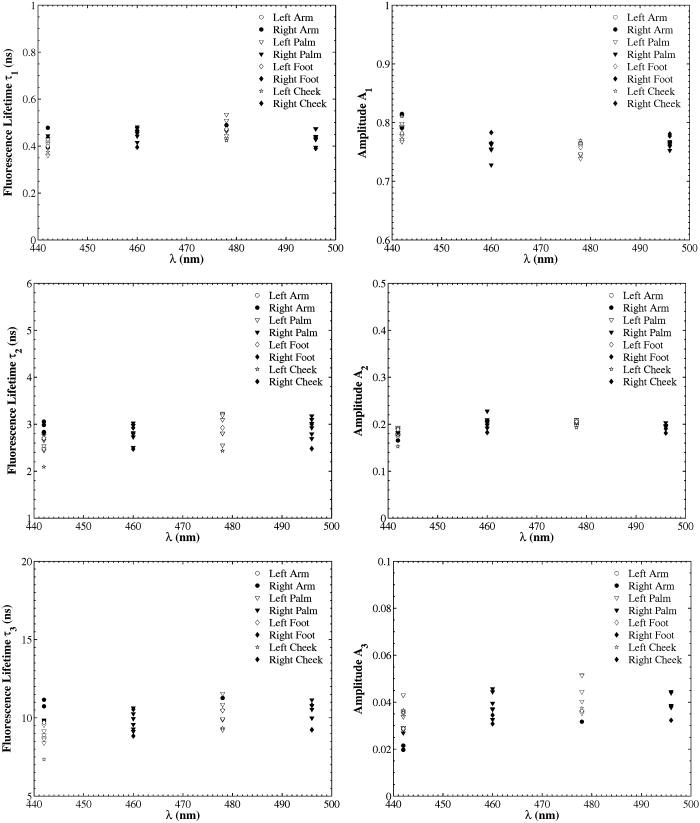 Figure 4 shows the raw data of the fluorescence lifetimes and their corresponding amplitudes at an emission wavelength of for 37 healthy subjects and 38 diabetic subjects of various ages, genders, and skin complexion obtained at the VA and UCLA. The error bars represent asymptotic standard errors in the fluorescence lifetimes obtained using the Fluofit software package. To further analyze the fluorescence lifetime data, various factors varying from one individual to another were considered, namely, (1) skin complexion (2) gender, and (3) age. The statistical analysis used was the Student’s -test assuming unequal variance. Based on this test, a two-tailed value, defined as the probability that the difference between two groups randomly occurred during the experiment, was assumed to be statistically significant. Fig. 4Effect of age on the fluorescence lifetimes , , and and fractional amplitudes , , and for healthy and diabetic subjects at excitation and emission wavelengths of 375 nm and , respectively.  4.1.Effect of Skin Complexion and GenderFigure 5 shows the fluorescence lifetimes , , and and their corresponding amplitudes , , and as a function skin complexion for healthy subjects at an emission wavelength of . The figure indicates that the fluorescence lifetimes do not significantly vary for different skin complexions. Using the Fisher’s exact test,41 the fluorescence lifetimes and fractional amplitudes of healthy subjects with dark complexion and light complexion were compared. The light-complexioned group consisted of 10 Caucasian subjects, age , while the dark-complexioned group was composed of 10 Hispanic, Persian, South Asian, and African-American subjects, age . Based on these test results, no statistically significant difference in average fluorescence lifetimes and fractional amplitudes exists between these two groups ( in all cases). Note that measurements took longer for dark skin. However, skin complexion had no effect on the lifetimes and fractional amplitudes. Fig. 5Effect of skin complexion on the fluorescence lifetimes , , and and fractional amplitudes , , and as a function of age for healthy subjects at excitation and emission wavelengths of 375 nm and , respectively.  Moreover, Fig. 6 shows the fluorescence lifetimes and amplitudes as a function of gender for healthy subjects in the same age group at the same emission wavelength of . Again, there are no noticeable trends in the fluorescence lifetimes with respect to gender. The comparison of the fluorescence lifetimes and fractional amplitudes of 15 healthy female subjects, average age , and 22 healthy male subjects, average age , did not produce statistically significant differences ( for all cases). Thus, Figs. 5 and 6 as well as the statistical analysis suggest that fluorescence lifetimes and fractional amplitudes do not vary with skin complexion and gender. The same conclusions were made for other emission wavelengths (data not shown). 4.2.Effect of AgeFinally, an attempt was made to model the fluorescence lifetimes of healthy subjects shown in Fig. 4 as a function of age using linear regression. The square of the correlation coefficient was less than 0.03 for all three lifetimes, thus indicating that variations in fluorescence lifetimes with age cannot be described by a linear model (data not shown). Moreover, the small regression coefficients in all the cases also indicate that the three lifetimes do not depend on the age of the subject. Student’s -tests were performed on all six parameters (fluorescence lifetimes and fractional amplitudes) comparing young and old healthy subjects. In addition, 15 subjects in both the young and old groups were compared with average ages of and , respectively. No statistically significant difference was detected for any of the parameters . Thus, the lifetimes and fractional amplitudes obtained for healthy subjects are statistically independent of age, gender, and skin complexion. Table 4 presents the mean values and the standard deviations of the fluorescence lifetimes and their corresponding fractional amplitudes for healthy subjects, providing reference values for healthy human skin. This clearly demonstrates the advantage of time-resolved fluorescence over steady-state fluorescence in that it is insensitive to age and skin complexion. Table 4Statistics of the decay parameters obtained on the left palm of 18 healthy and 27 diabetic subjects at an emission wavelength of 442nm ; the reported p values were obtained using the unpaired Student’s t -test to compare healthy and diabetic populations.
4.3.Effect of DiabetesTable 4 summarizes the experimental data collected for 18 healthy subjects and 27 age-matched diabetic subjects. Their fluorescence lifetimes and fractional amplitudes were compared by means of an unpaired Student’s -test. Only the fractional amplitudes and produced statistically significant differences in the means of the diabetic and the healthy patients. This was based on the criteria that for the difference between average values to be considered significant. Additionally, the relative contributions of each lifetime to the overall intensity of diabetic and healthy subjects were compared using the Student’s -test. The fractional contribution of a single lifetime to the steady-state intensity can be defined as4 However, no statistically significant differences were found for any of the three fluorescence lifetimes considered. The same conclusions were reached for the other emission wavelengths considered (data not shown).Further testing was performed on only the diabetic subjects, comparing duration of diabetes as well as average HbA1c values over the past . To test the effect of diabetes duration, the diabetic subjects were divided into two groups with an average of since diagnosis in the shorter duration group and in the longer duration group. However, no statistically significant difference was found between these two groups when performing the unpaired Student’s -test. Similarly, any correlation with average HbA1c from the previous was tested by dividing the diabetic subjects into two groups: one with a low average HbA1c of and higher average HbA1C of . No significant difference was detected between these two groups ( for all cases). Additionally, 18 diabetic subjects with foot ulcers, aged , were compared with 18 age-matched healthy subjects, average age , using the Student’s -test. Diabetic subjects with foot ulcers were specifically chosen because many diabetic subjects who develop ulcers also have other comorbidities associated with diabetes.42, 43 Thus, this group represents subjects whose AGE accumulation is expected to be much higher than other diabetic subjects. Not only were statistically significant differences noted between the two groups for fractional amplitudes and , but also differences in lifetime between the two groups was also statistically significant, albeit with a value of 0.038. All the test results are presented in Table 5 . Given the long half-life of collagen in skin44 , one can expect changes in the time-resolved fluorescence properties of skin to correlate more with the occurrence of diabetic complications than with HbA1c values. This measurement would indicate the long-term accumulation of AGEs and other oxidative damage. The rate at which tissue accumulates AGEs is also dependent on various genetic or metabolic factors.45 Therefore, not all diabetic subjects are as susceptible to the development of complications, in spite of poor blood glucose control and high HbA1c levels. The development of complications cannot be predicted by conventional treatment monitoring such as blood glucose measurements and HbA1c tests. Finally, nine diabetic subjects without foot ulcers were compared with 18 age-matched healthy subjects using the Student’s -test. No statistically significant differences between the two groups were detected in any of the parameters except in amplitude ( value of 0.045). This indicates that the differences in the amplitude and between 18 healthy and 27 diabetic subjects reported earlier might be mainly due to the diabetic subjects with foot ulcers. Table 5Statistics of the decay parameters on the left palm of 18 diabetic subjects with foot ulcers and 18 age-matched healthy subjects at an emission wavelength of 442nm ; the reported p values were obtained using the unpaired Student’s t -test to compare healthy and diabetic populations.
While a previous study by Meerwaldt 34 showed that steady-state autofluorescence measurements correlated with age, diabetes duration, and mean HbA1c of the previous year, this study did not find any significant relationships between the fluorescence lifetimes and amplitudes and these variables. Meerwaldt 34 used a polychromatic excitation source emitting at wavelengths ranging from 300 to and fluorescence was measured over the entire window of 420 to . This is in contrast with this study, where the excitation source was a monochromatic diode emitting at (spectral width of around ) and fluorescence was measured at 442, 460, 478, and with spectral width of 3 nm. It is speculated that these differences in the excitation wavelength might be the source of the different conclusions obtained in the two studies. This study should be repeated for a different excitation wavelength between 300 and and emission wavelength between 420 and to corroborate results by Meerwaldt 34 4.4.Identification of FluorophoresIn an earlier study on fluorescence lifetime measurements on human skin,33 two fluorescence lifetimes of 0.4 and at the stratum spinosum were reported using multiphoton excitation at , equivalent to single-photon excitation at . In the presented study, similar values were found when the decays were fit to a triexponential model. This suggests that the fluorophores with the high fractional amplitudes and in our measurements originate, at least in part, from the stratum spinosum. Our measurements are detecting another fluorophore as well, perhaps deeper in the tissue, which would explain the lower contribution of this fluorophore to the overall fluorescence signal. The similarities between our results and the previously reported data help to validate our results in spite of using different multiexponential models. Moreover, the shorter two lifetimes around and around observed in our measurements were similar to the lifetimes of free and protein-bound NADH reported in literature.31, 46 Indeed, Schneckenburger 46 studied the autofluorescence from cultivated endothelial cells and determined the fluorescence lifetime of free and protein-bound NADH to be between 0.4 and 0.5 and between 2.0 to , respectively. In addition, Konig and Riemann31 also reported a fluorescence lifetime of at a depth of within the skin, which could possibly be attributed to bound NADH. Based on these studies, it is speculated that the two shorter fluorescence lifetimes and correspond to free and protein-bound NADH, respectively. This suggests that the differences in fractional amplitudes and observed between diabetic and healthy subjects are related to the metabolic states of their tissues rather than directly detecting the presence of glycation products. However, as the presence of glycation products is known to increase tissue oxidative stress,47, 48 they may have an indirect effect on our measurements. Furthermore, it is speculated that the third observed average lifetime equal to for healthy subjects corresponds to collagen cross-links formed34, 38 by AGEs. However, our data on diabetic subjects seem to contradict this speculation. The longest lifetime and the corresponding fractional amplitude are not significantly different between diabetic and healthy subjects. Given the known correlation between AGEs and diabetes and skin steady-state autofluorescence,34 one would expect the fractional amplitude of the third lifetime to increase with increasing AGE accumulation, if the lifetime could be attributed to AGEs. With elevated concentration of AGEs in the skin, their fluorescence signal would be stronger and, thus, contribute a higher fractional intensity. Further in vitro experimentation is required to precisely determine the origin of this lifetime. 5.ConclusionsWe presented the design and implementation of an experimental apparatus based on TCSPC assembled to measure autofluorescence lifetimes of human skin. With an excitation wavelength of and pulse width of , fluorescence was detected at wavelengths of 442, 460, 478, and . The device was tested on various locations of a 31-yr-old healthy male Caucasian subject as well as the palms of 37 healthy subjects and 38 diabetic subjects. The following conclusions were drawn:
The fluorescence lifetime data of healthy subjects is of particular interest as a baseline especially for using fluorescence lifetimes of NADH to noninvasively sense glucose concentrations14 as well as monitoring diseases and skin conditions such as skin cancer, wounds, and ulcers. AcknowledgmentsThe authors would like to thank Dr. Mark Elliot for insightful discussion and Evon Fanous for her help at the Veteran’s Administration, Los Angeles. This work was supported by UCLA Office of Intellectual Property Administration, UCLA Faculty Senate Grant, and by the Diabetes Action Research and Education Foundation. ReferencesR. Richards-Kortum and
E. Sevick-Muraca,
“Quantitative optical spectroscopy for tissue diagnostics,”
Annu. Rev. Phys. Chem., 47 555
–606
(1996). https://doi.org/10.1146/annurev.physchem.47.1.555 0066-426X Google Scholar
J. D. Pitts and
M.-A. Mycek,
“Design and development of a rapid acquisition laser-based fluorometer with simultaneous spectral and temporal resolution,”
Rev. Sci. Instrum., 72 3061
–3072
(2001). https://doi.org/10.1063/1.1379957 0034-6748 Google Scholar
Q. Fang,
T. Papaioannou,
J. A. Jo,
R. Vaitha,
K. Shastry, and
L. Marcu,
“Time-domain laser-induced fluorescence spectroscopy apparatus for clinical diagnostics,”
Rev. Sci. Instrum., 75
(1), 151
–162
(2004). https://doi.org/10.1063/1.1634354 0034-6748 Google Scholar
J. R. Lakowicz, Principles of Fluorescence Spectroscopy, Kluwer Academic/Plenum Publishers, New York (1999). Google Scholar
American Diabetes Association,
“Economic costs of diabetes in the U.S. in 2002,”
Diabetes Care, 26 917
–932
(2003). 0149-5992 Google Scholar
American Diabetes Association,
“Diagnosis and classification of diabetes mellitus,”
Diabetes Care, 29
(Suppl.1), S43
–S48
(2006). 0149-5992 Google Scholar
M. Engelgau,
K. Narayan, H. W. H.,
“Screening for type 2 diabetes,”
Diabetes Care, 23 1563
–1580
(2000). 0149-5992 Google Scholar
D. B. Sacks,
D. E. Bruns,
D. E. Goldstein,
N. K. Maclaren,
J. M. McDonald, and
M. Parrott,
“Guidelines and recommendations for laboratory analysis in the diagnosis and management of diabetes mellitus,”
Clin. Chem., 48 436
–472
(2002). 0009-9147 Google Scholar
R. Singh,
A. Barden,
T. Mori, and
L. Beilin,
“Advanced glycation end-products: a review,”
Diabetologia, 44 129
–146
(2001). 0012-186X Google Scholar
R. Na,
I. Stender,
M. Henrikson, and
H. Wulf,
“Autofluorescence of human skin is age-related when corrected for skin-pigmentation and redness,”
J. Invest. Dermatol., 116 536
–540
(2001). https://doi.org/10.1046/j.1523-1747.2001.01285.x 0022-202X Google Scholar
D. Sell,
R. Nagaraj,
S. Grandhee,
P. Odetti,
A. Lapolla,
J. Fogarty, and
V. Monnier,
“Pentosidine: a molecular marker for the cumulative damage due to proteins in diabetes, aging and uremia,”
Diabetes/Metab. Rev., 7
(4), 239
–251
(1991). 0742-4221 Google Scholar
V. Monnier,
G. Mustata,
K. Beimel,
O. Reihl,
M. Lederer,
D. Zhenyu, and
D. Sell,
“Cross-linking of the extracellular matrix by the Maillard reaction in aging and diabetes,”
Ann. N.Y. Acad. Sci., 1043 533
–544
(2005). 0077-8923 Google Scholar
M. Meli,
R. Granouillet,
E. Reynaud,
A. Chamson,
J. Frey, and
C. Perier,
“In vitro glycoxidation of insoluble fibrous type i collagen: solubilization and advanced glycation end prodcuts,”
J. Protein Chem., 22
(6), 527
–531
(2003). 0277-8033 Google Scholar
N. Evans,
L. Gnudi,
O. Rolinski,
D. Birch, and
J. Pickup,
“Glucose-dependent changes in NAD(P)H-related fluorescence lifetime of adipocytes and fibroblasts in vitro: potential for non-invasive glucose sensing in diabetes mellitus,”
J. Photochem. Photobiol., B, 80
(2), 122
–129
(2005). https://doi.org/10.1016/j.jphotobiol.2005.04.001 1011-1344 Google Scholar
D. P. O’Neal,
M. J. McShane,
M. V. Pishko, and
G. L. Cote,
“Implantable biosensors: if analysis of fluorescent light propagation through skin,”
Optical Diagnostics and Sensing of Biological Fluids and Glucose and Cholesterol Monitoring Proc. SPIE, 4263 20
–24 2001). Google Scholar
A. Pradhan,
B. B. Das,
K. M. Yoo,
R. R. Alfano,
J. Cleary,
R. Prudente, and
E. J. Celmer,
“Time-resolved fluorescence of benign and malignant breast tissues,”
Proc. SPIE, 1599
(1), 81
–84
(1992). 0277-786X Google Scholar
T. M. Glanzmann,
J.-P. Ballini,
P. Jichlinski,
H. van den Bergh, and
G. A. Wagnieres,
“Tissue characterization by time-resolved fluorescence spectroscopy of endogenous and exogenous fluorochromes: apparatus design and preliminary results,”
Proc. SPIE, 2926 41
–50
(1996). 0277-786X Google Scholar
T. Glanzmann,
J.-P. Ballini,
H. van den Bergh, and
G. Wagnieres,
“Time-resolved spectrofluorometer for clinical tissue characterization during endoscopy,”
Rev. Sci. Instrum., 70 4067
–4077
(1999). https://doi.org/10.1063/1.1150038 0034-6748 Google Scholar
T. M. Glanzmann,
P. Uehlinger,
J.-P. Ballini,
A. Radu,
T. Gabrecht,
P. Monnier,
H. van den Bergh, and
G. A. Wagnieres,
“Time-resolved autofluorescence spectroscopy of the bronchial mucosa for the detection of early cancer: clinical results,”
Proc. SPIE, 4432 199
–209
(2001). 0277-786X Google Scholar
J. Mizeret,
T. Stepinac,
M. Hansroul,
A. Studzinski,
H. van den Bergh, and
G. Wagnieres,
“Instrumentation for real-time fluorescence lifetime imaging in endoscopy,”
Rev. Sci. Instrum., 70 4689
–4701
(1999). https://doi.org/10.1063/1.1150132 0034-6748 Google Scholar
T. J. Pfefer,
D. Y. Paithankar,
J. M. Poneros,
K. T. Schomacker, and
N. S. Nishioka,
“Temporally and spectrally resolved fluorescence spectroscopy for the detection of high grade dysplasia in Barrett’s esophagus,”
Lasers Surg. Med., 32
(1), 10
–16
(2003). https://doi.org/10.1002/lsm.10136 0196-8092 Google Scholar
D. Schweitzer,
A. Kolb,
M. Hammer, and
E. Thamm,
“Tau-mapping of the autofluorescence of the human ocular fundus,”
Proc. SPIE, 4164 79
–89
(2000). https://doi.org/10.1117/12.410636 0277-786X Google Scholar
D. Schweitzer,
A. Kolb, and
M. Hammer,
“Autofluorescence lifetime measurements in images of the human ocular fundus,”
Proc. SPIE, 4432 29
–39
(2001). 0277-786X Google Scholar
D. Schweitzer,
M. Hammer,
F. Schweitzer,
R. Anders,
T. Doebbecke,
S. Schenke,
E. R. Gaillard, and
E. R. Gaillard,
“In vivo measurement of time-resolved autofluorescence at the human fundus,”
J. Biomed. Opt., 9
(6), 1214
–1222
(2004). https://doi.org/10.1117/1.1806833 1083-3668 Google Scholar
J.-M. I. Maarek,
L. Marcu,
M. C. Fishbein, and
W. S. Grundfest,
“Time-resolved fluorescence of human aortic wall: use for improved identification of atherosclerotic lesions,”
Lasers Surg. Med., 27 241
–254
(2000). https://doi.org/10.1002/1096-9101(2000)27:3<241::AID-LSM6>3.0.CO;2-0 0196-8092 Google Scholar
L. Marcu,
W. S. Grundfest, and
J.-M. I. Maarek,
“Arterial fluorescent components involved in atherosclerotic plaque instability: differentiation by time-resolved fluorescence spectroscopy,”
Proc. SPIE, 4244 428
–433
(2001). 0277-786X Google Scholar
R. Cubeddu,
A. Pifferi,
P. Taroni,
A. Torricelli,
G. Valentini, and
E. Sorbellini,
“Fluorescence lifetime imaging: an application to the detection of skin tumors,”
IEEE J. Sel. Top. Quantum Electron., 5
(4), 122
–132
(1999). 1077-260X Google Scholar
R. Cubeddu,
D. Comelli,
C. D’Andrea,
P. Taroni, and
G. Valentini,
“Clinical system for skin tumour detection by fluorescence lifetime imaging,”
IEEE Eng. Med. Biol. Mag., 3 2295
–2296
(2002). 0739-5175 Google Scholar
J. Siegel,
D. S. Elson,
S. E. D. Webb,
K. C. B. Lee,
A. Vlandas,
G. L. Gambaruto,
S. L. -Fort,
M. J. Lever,
P. J. Tadrous,
G. W. H. Stamp,
A. L. Wallace,
A. Sandison,
T. F. Watson,
F. Alvarez, and
P. M. W. French,
“Studying biological tissue with fluorescence lifetime imaging: microscopy, endoscopy, and complex decay profiles,”
Appl. Opt., 42
(16), 2995
–3004
(2003). https://doi.org/10.1364/AO.42.002995 0003-6935 Google Scholar
K. Koenig,
U. Wollina,
I. Riemann,
C. Peukert,
K.-J. Halbhuber,
H. Konrad,
P. Fischer,
V. Fuenfstueck,
T. W. Fischer, and
P. Elsner,
“Optical tomography of human skin with subcellular spatial and picosecond time resolution using intense near infrared femtosecond laser pulses,”
Proc. SPIE, 4620 191
–201
(2002). https://doi.org/10.1117/12.470692 0277-786X Google Scholar
K. Konig and
I. Riemann,
“High-resolution multiphoton tomography of human skin with subcellular spatial resolution and picosecond time resolution,”
J. Biomed. Opt., 8
(3), 432
–439
(2003). https://doi.org/10.1117/1.1577349 1083-3668 Google Scholar
I. Riemann,
E. Dimitrov,
P. Fischer,
A. Reif,
M. Kaatz,
P. Elsner, and
K. Konig,
“High-resolution multiphoton tomography of human skin in vivo and in vitro,”
Proc. SPIE, 5463 21
–28
(2004). 0277-786X Google Scholar
A. Ehlers,
I. Riemann,
T. Anhut,
M. Kaatz,
P. Elsner, and
K. Konig,
“Fluorescence lifetime imaging of human skin and hair,”
Proc. SPIE, 6089 N1
–N10
(2006). 0277-786X Google Scholar
R. Meerwaldt,
R. Graaff,
P. H. N. Oomen,
T. P. Links,
J. J. Jager,
N. L. Alderson,
S. R. Thorpe,
J. W. Baynes,
R. O. B. Gans, and
A. J. Smit,
“Simple non-invasive assessment of advanced glycation endproduct accumulation,”
Diabetologia, 47 1324
–1330
(2004). 0012-186X Google Scholar
R. Meerwaldt,
T. P. Links,
R. Graaff,
K. Hoogenberg,
J. D. Lefrandt,
J. W. Baynes,
R. O. B. Gans, and
A. J. Smit,
“Increased accumulation of skin advanced glycation end-products precedes and correlates with clinical manifestation of diabetic neuropathy,”
Diabetologia, 48 1637
–1644
(2005). 0012-186X Google Scholar
H. L. Lutgers,
H. J. Bilo,
R. Graaff,
R. O. Gans,
T. P. Links,
A. J. Smit, and
L. J. Ubink-Veltmaat,
“Skin autofluorescence as a noninvasive marker of vascular damage in patients with type 2 diabetes,”
Diabetes Care, 29
(12), 2654
–2659
(2006). 0149-5992 Google Scholar
C. Brown,
H. Davis,
M. Ediger,
C. Fleming,
E. Hull, and
M. Rohrscheib,
“Clinical assessment of near-infrared spectroscopy for noninvasive diabetes screening,”
Diabetes Technol. Ther., 7
(3), 456
–466
(2005). Google Scholar
E. Hull,
M. Ediger,
A. Unione,
E. Deemer,
M. Stroman, and
J. Baynes,
“Noninvasive, optical detection of diabetes: model studies with porcine skin,”
Opt. Express, 12
(19), 4496
–4510
(2004). https://doi.org/10.1364/OPEX.12.004496 1094-4087 Google Scholar
J. Maynard,
M. Rohrscheib,
J. Way,
C. M. Nguyen, and
M. N. Ediger,
“Noninvasive type 2 diabetes screening: superior sensitivity to fasting plasma glucose and alc,”
Diabetes Care, 30
(5), 1120
–1124
(2007). 0149-5992 Google Scholar
R. H. Na,
I. M. Stender,
M. Henriksen, and
H. C. Wulf,
“Autofluorescence of human skin is age-related after correction for skin pigmentation and redness,”
J. Invest. Dermatol., 116 536
–540
(2001). https://doi.org/10.1046/j.1523-1747.2001.01285.x 0022-202X Google Scholar
S. Glantz, Primer of Biostatistics, McGraw-Hill, New York (2002). Google Scholar
R. Nelson,
D. Gohdes,
J. Everhart,
J. Hartner,
F. Zwemer,
D. Pettitt, and
W. Knowler,
“Lower-extremity amputations in NIDDM: 12-yr follow-up study in Pima Indians,”
Diabetes Care, 11
(1), 8
–16
(1988). 0149-5992 Google Scholar
G. Reiber,
R. Pecoraro, and
T. Koepsell,
“Risk factors for amputation in patients with diabetes mellitus. a case control study,”
Ann. Intern Med., 117
(2), 97
–105
(1992). 0003-4819 Google Scholar
N. Verzijl,
J. DeRoot,
S. Thorpe,
R. A. Bank,
J. N. Shaw,
T. J. Lyons,
J. W. J. Bijlsma,
F. P. J. G. Lafeber,
J. W. Baynes, and
J. M. TeKoppele,
“Effect of collagen turnover on the accumulation of advanced glycation end products,”
J. Biol. Chem., 275
(50), 39027
–39031
(2000). https://doi.org/10.1074/jbc.M006700200 0021-9258 Google Scholar
H. Vlassara and
M. Palace,
“Diabetes and advanced glycation endproducts,”
J. Intern Med., 251
(2), 87
–101
(2002). 0954-6820 Google Scholar
H. Schneckenburger,
M. Wagner,
P. Weber,
W. S. Strauss, and
R. Sailer,
“Autofluorescence lifetime imaging of cultivated cells using a UV picosecond laser diode,”
J. Fluoresc., 14
(5), 649
–654
(2004). https://doi.org/10.1023/B:JOFL.0000039351.09916.cc 1053-0509 Google Scholar
T. Wendt,
N. Tanji,
J. Guo,
B. Hudson,
A. Bierhaus,
R. Ramasamy,
B. Arnold,
P. Nawroth,
S. F. Yan,
V. D’Agati, and
A. Schmidt,
“Glucose, glycation and RAGE: implication for amplification of cellular dysfunction in diabetic nephropathy,”
J. Am. Soc. Nephrol., 14
(5), 1383
–1395
(2003). 1046-6673 Google Scholar
J. W. Baynes and
S. R. Thorpe,
“Role of oxidative stress in diabetic complications: a new perspective on an old paradigm,”
Diabetes, 48
(1), 1
–9
(1999). 0012-1797 Google Scholar
|