

|
|
|
Biological speckle has a dual character. On one hand, it is a parasitic effect that degrades the contrast of biomedical imaging, and many approaches seek speckle reduction.1 On the other hand, speckle provides strong statistical information about scattering media and can be used for interferometric imaging of cells.2 Dynamic speckle, in particular, has considerable information content. For instance, dynamic speckle can be used to monitor blood flow3 and can assess the health of living tissue using intracellular motion as a fully endogenous imaging contrast agent.4 3-D imaging approaches are particularly important for assessing tissue viability, pharmacological toxicity, and cancer progression,5 and can be provided by coherence-domain techniques6 and digital holography.7 Holography captures high-contrast depth-gated speckle statistics because of broad-field illumination.8 We previously used coherence-gated digital holography to capture intracellular motion in 3-D tissue as an imaging contrast agent9 based on the statistical fluctuations of dynamic speckle. However, there are many functional causes of subcellular motion, and an overall motility metric does not capture specific functions. In this work, we perform fluctuation spectroscopy on depth-gated dynamic speckle to generate frequency versus time spectrograms of tissue responding to various environmental and pharmacological perturbations. The spectral responses depend on the specific type of perturbation, and these spectral responses can serve as functional fingerprints for tissue-based screening. Holograms in short coherence digital holography were recorded and reconstructed from the experimental setup shown in Fig. 1 . Lenses L1 and L2 expanded a reference beam, and lens L3 performed the Fourier transform of the object beam. Details of the experimental configuration are discussed in Ref. 9. We used rat osteogenic sarcoma tumor spheroids as the target tissue samples.10 Multicellular tumor spheroids have approximately spherical geometry that facilitates comparison of structure to function. A typical pseudo-B-scan image is shown in Fig. 1, which is produced from 3-D holographic images of an -diam rat tumor spheroid. Fig. 1Experimental setup. M, mirrors; ND, neutral density filter; PBS, polarizing beamsplitters; BS, beamsplitter; L1, L2, and L3, lenses; , half-wave plate; , quarter-wave plate; FP, Fourier plane; FFT, fast Fourier transform. 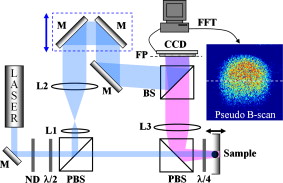 To generate frequency versus time spectrograms, we acquired 300 successive digital holograms at two acquisition rates (200 holograms for and 100 holograms for ) every for three hours at a fixed depth. Each digital hologram is acquired from a single frame with an exposure time of . In frequency versus time spectrograms, the frequency resolution is for the high frequency band and for the low frequency band; the time resolution is . Figure 2 shows the cross section image from 200 digital holograms acquired with 10 frames per second for a healthy tumor spheroid. The horizontal axis is the spatial axis and time is vertical. The reconstructed high-contrast speckle shows dynamic character as individual speckle intensities fluctuate strongly. Fig. 2(a) Middle cross section image reconstructed from successive digital holograms of a -diam healthy tumor at a fixed depth of . (b) Normalized power spectrum as a function of frequency comparing the proliferating shell with the necrotic core of the healthy tumor. (c) Normalized power spectrum as a function of frequency at the selected times, in the proliferating shell after treatment with nocodazole, and (d) the associated normalized spectral difference as a function of time at the selected frequencies. 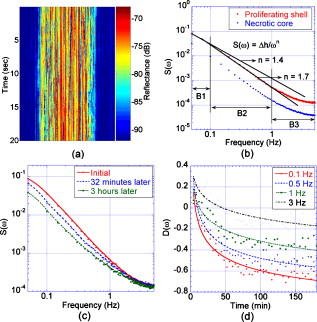 The two equivalent approaches to time-series analysis of fluctuating speckle are temporal autocorrelation and power spectra. Autocorrelation of holographic speckle yields a first-order heterodyne function,11 because holography uses a reference wave (the coherence gate) that captures the real and imaginary parts of the fluctuating field as the coherence-gated pixel number . The autocorrelation function is where is the time delay among an ensemble of images, and is the heterodyne correlation function. Our previous motility metric9 was defined from the heterodyne correlation function as the normalized standard deviation, or speckle contrast, given byAutocorrelation functions and power spectra are related through a Fourier transform. Although the autocorrelation function and the power spectrum contain identical information, the interpretation of that information is qualitatively different. In particular, the spectral information directly displays the presence of characteristic frequencies that can be related to biophysical processes, such as fluctuating membranes or organelle transport.12The spectral power density of a -diam tumor is shown in Fig. 2 for the proliferating shell and the necrotic core. The power spectra exhibit behavior from 0.1 to about with an exponent of 1.7. The shell is significantly more active than the core, but part of the core activity can be ascribed to the shimmering showerglass effect from the dynamic overlying tissue layers. The slopes of the power spectral density show a break above , which is likely due to Nyquist sampling. For tissue responding to stimuli, such as temperature and osmolarity changes or response to drugs, the key property of the spectral power density is its relative change in response to the stimulus. The normalized spectral difference for a time series is given by where is the starting spectral power density at the beginning time of the experiment, and is the time development of the spectral power density. The normalized power spectrum of a -diam tumor responding to a dose of of nocodazole, an antitubulin cytoskeletal drug, is shown in Fig. 2 at the selected times after the application of the drug. The differential relative spectral change is shown in Fig. 2 as a function of time for the selected frequencies. The higher frequencies change relatively less than the lower frequencies in response to nocodazole.The tissue response contained in can be represented as a spectrogram, showing the relative change in the spectrum as a function of time. Examples of several spectrograms are shown in Fig. 3 . These spectrograms track the changes of the intracellular motion in living tumors responding to temperature changes, osmolarity changes, and to nocodazole. The spectral difference in response to changes in temperature is shown in Fig. 3 as the temperature increased from and then decreased to . The spectral weight shifts to higher frequencies with increasing temperature. Fig. 3Maps of the normalized spectral difference as a function of time and frequency for (a) thermal change, (b) hypotonic change of osmolarity, (c) hypertonic change of osmolarity, and (d) nocodazole. The differential relative spectral change as a function of time is shown at the frequency of (e) 0.01 and (f) .  Osmolarity has a strong effect on the exchange of water into cells and tissue. Hypotonic conditions lead to strong cellular swelling, or edema, and possibly cell lysis, while hypertonic conditions dessicate the cells and cause them to contract. We monitored the change in the relative spectral density as we changed the osmolarity of the growth medium around the tumors. Isotonic conditions are . The results of hypotonic conditions are shown in Fig. 3. The lower frequencies show weak suppression, while the upper frequencies show initial enhanced motion that slowly relaxes over . The hypertonic condition is shown in Fig. 3. The hypertonic effects on the spectrogram are opposite the hypotonic, stronger, and last longer. Cellular swelling increases the cell volume, decreases the density of intracellular constituents, and facilitates intracytosol motion. This leads to increases in motion in the higher frequencies of Fig. 3. On the other hand, dessication of the cytosol under hypertonic conditions shrinks the cell volume and increases the density of intracellular constituents, significantly impeding motion. However, membrane vesicles may still be active to reestablish stasis. The tissue response to the antitubulin drug nocodazole shows very strong suppression in motion in the middle frequency range between , but with enhancement at ultralow frequency below . The strongest effect of nocodazole on intracellular motion is the reduction of microtubules in the cytosol that provides fewer pathways for organelle transport corresponding to strong suppression of frequencies above . This same frequency range showed enhanced motion at physiological temperatures relative to room temperature. Low cellular metabolism at room temperature would have slower organelle transport. These differences in the tissue response reflect the specific actions of the perturbations on the tissue. Increasing temperature increases metabolic activity and increases membrane fluidity, reflected in the preferential enhancement of frequencies around at physiological temperatures relative to room temperature. Conversely, osmotic hypotonicity induces tension on the cell membrane, increasing the effective undulation frequency while reducing damping, reflected in the enhanced fluctuations across the spectral range of Fig. 3, with opposite effects for hypertonicity. In contrast, the antitubulin action of nocodazole decreases the number of microtubules in the cells and therefore specifically inhibits organelle motion, reflected in the strong suppression of the midfrequency fluctuations. These spectral cues allow a tentative identification of the low frequencies as part of the spectrum of membrane undulations (up to ), while the higher frequency originates with active organelle transport. This spectral range assignment is consistent with Ref. 13. In conclusion, we apply speckle fluctuation spectroscopy to dynamic speckle obtained using coherence-gated digital holography on living tumor spheroids. By defining a relative spectral response to perturbations, we generate spectrograms of the tissue responding to temperature changes, osmolarity changes, and to the antitubulin drug nocodazole. Different spectral ranges increase or decrease, depending on the perturbation, providing insight into the different cellular functions that contribute to different spectral ranges. The striking changes in the responses to various perturbations provide a means to develop spectrogram fingerprints that can be used to identify the effects of drugs on cellular activity. Therefore, the spectrograms define the specificity of motility-contrast imaging to different perturbations and to different functional responses. These signatures and their specificity may open the door to broad compound screening applications. AcknowledgmentsThis work was supported by the National Science Foundation grant CBET-0756005. Jeong gratefully acknowledges financial support from the STX Foundation. ReferencesM. Bashkansky and J. Reintjes,
“Statistics and reduction of speckle in optical coherence tomography,”
Opt. Lett., 25 545
–547
(2000). https://doi.org/10.1364/OL.25.000545 0146-9592 Google Scholar
Y. Park, W. Choi, Z. Yaqoob, R. Dasari, K. Badizadegan, and M. S. Feld,
“Speckle-field digital holographic microscopy,”
Opt. Express, 17 12285
–12292
(2009). https://doi.org/10.1364/OE.17.012285 1094-4087 Google Scholar
D. A. Boas and A. K. Dunn,
“Laser contrast speckle imaging in biomedical optics,”
J. Biomed. Opt., 15 011109
(2010). https://doi.org/10.1117/1.3285504 1083-3668 Google Scholar
P. Yu, L. Peng, M. Mustata, J. J. Turek, M. R. Melloch, and D. D. Nolte,
“Time-dependent speckle in holographic optical coherence imaging and the state of health of tumor tissue,”
Opt. Lett., 29 68
–70
(2004). https://doi.org/10.1364/OL.29.000068 0146-9592 Google Scholar
G. Y. Lee, P. A. Kenny, E. H. Lee, and M. J. Bissell,
“Three-dimensional culture models of normal and malignant breast epithelial cells,”
Nat. Methods, 4 359
–365
(2007). https://doi.org/10.1038/nmeth1015 1548-7091 Google Scholar
A. F. Fercher, W. Drexler, C. K. Hitzenberger, and T. Lasser,
“Optical coherence tomography—principles and applications,”
Rep. Prog. Phys., 66 239
–303
(2003). https://doi.org/10.1088/0034-4885/66/2/204 0034-4885 Google Scholar
U. Schnars and W. P. O. Jüptner,
“Digital recording and numerical reconstruction of holograms,”
Meas. Sci. Technol., 13 R85
–R101
(2002). https://doi.org/10.1088/0957-0233/13/9/201 0957-0233 Google Scholar
K. Jeong, J. J. Turek, M. R. Melloch, and D. D. Nolte,
“Functional imaging in photorefractive tissue speckle holography,”
Opt. Commun., 281 1860
–1869
(2008). https://doi.org/10.1016/j.optcom.2007.04.067 0030-4018 Google Scholar
K. Jeong, J. J. Turek, and D. D. Nolte,
“Volumetric motility-contrast imaging of tissue response to cytoskeletal anti-cancer drugs,”
Opt. Express, 15 14057
–14064
(2007). https://doi.org/10.1364/OE.15.014057 1094-4087 Google Scholar
J. Friedrich, C. Seidel, R. Ebner, and L. A. Kunz-Schughart,
“Spheroid-based drug screen: considerations and practical approach,”
Nat. Protoc., 4 309
–324
(2009). https://doi.org/10.1038/nprot.2008.226 1750-2799 Google Scholar
B. J. Berne and R. Pecora, Dynamic Light Scattering: with Applications to Chemistry, Biology, and Physics, Dover, Mineola, NY
(2000). Google Scholar
D. Boal, Mechanics of the Cell, Cambridge Univ. Press, Cambridge, UK
(2002). Google Scholar
K. J. De Vos and M. P. Sheetz,
“Visualization and quantification of mitochondrial dynamics in living animal cells,”
Methods Cell Biol., 80 627
–682
(2007). https://doi.org/10.1016/S0091-679X(06)80030-0 0091-679X Google Scholar
|


