
|
|
1.IntroductionOver the last decade, several biophotonic approaches have been undertaken in view of developing innovative diagnostic methods to complement conventional histopathology. These techniques are foreseen as nondestructive helping tools for pathologists in their routine clinical practice. Among these, infrared (IR) spectroscopy is regarded as one of the candidate methods that could be of valuable interest for cancer diagnosis. This technique allows acquiring spectra from IR active biomolecules present in cells and tissues, whose chemical bonds undergo changes in their electric dipole moment during vibrations thus providing a highly specific “vibrational fingerprint.”1 The spectral information obtained in label-free and nondestructive manner offers insights into the presence of these biomolecules, as well as into their structural and metabolic changes, occurring on the onset and during the course of the disease.2 Combined with a micro-imaging device, IR spectroscopy can rapidly give spatially resolved biochemical information of different tissue structures, where each pixel of an IR image provides a complete spectrum.3 Via this modality, several studies have exploited IR spectroscopy as a helpful tool with a potential diagnostic value in various cancers like, but not limited to, skin,4 breast,5 cervix,6 colon,7 prostate,8,9 lung,10 esophagus,11 thyroid,12 brain.13 These IR studies were performed on tissues that were either fresh,11,12 frozen,5,10,13 or formalin-fixed paraffin-embedded (FFPE).6,8 Until recently, IR studies of FFPE tissues necessitated chemical dewaxing prior to image acquisition because of the strong contribution of IR absorption peaks of paraffin, which interfere with the biochemical information originating from the tissue. However, this procedure is time- and reagent-consuming and has been shown to result in an incomplete deparaffinization.14 An alternative way to circumvent chemical dewaxing is to perform a numerical deparaffinization directly on the IR spectral image. Thus, for the first time, the feasibility of IR imaging combined with numerical deparaffinization of paraffinized colon tissue arrays that are stabilized in an agarose matrix, without any chemical deparaffinization, was undertaken. In addition to paraffin, the agarose matrix also contributes to the confounding spectral interferences. Therefore, an algorithm based on extended multiplicative signal correction (EMSC) was implemented to neutralize these spectral interferences from paraffin and agarose. The processed IR images were then analyzed with a clustering method to identify and segment the constituent tissue structures based on their intrinsic molecular composition. This statistical approach permitted to construct color-coded images that were then compared with conventional histology for morphological recognition. From this procedure, identification of characteristic spectral signatures representing the biomolecular changes, useful for differentiating between normal and tumoral conditions, and tumor and tumor-associated stroma, was also undertaken. To demonstrate the proof-of-concept of spectral histopathology, we selected one of the highly incident cancers namely the colorectal cancer, that has an incidence of 1.2 million cases and 608,000 deaths worldwide in 2008.15 Although fecal occult blood test (FOBT),16 colonoscopy,17 and sigmoidoscopy18 are used for colorectal cancer screening and detection, presently the diagnosis is settled upon microscopic examination which remains the gold standard for cancer diagnosis. Nevertheless, the staining and morphological analyses do not allow interpretation of the molecular changes occurring within the cancerous tissue at that particular time. In such scenario, IR imaging could be a valuable complementary tool for conventional histopathological cancer tissue examination. 2.Materials and Methods2.1.Tissue Array PreparationTissue arrays are paraffinized tissue blocks in which chosen tissue cores have been assembled. The tissue array blocks were paraffinized and stabilized in an agarose matrix to reduce the common problem of tissue loss during sectioning and were manually prepared in the university pathology laboratory. Each tissue array block consisted of 13 tissue cores of approximately 3 mm in diameter from normal and tumoral colonic tissue. Samples were selected by an expert pathologist using the hematoxylin, phloxine and saffron (HPS) stained image as the reference. In this study, IR imaging analysis has been implemented on six samples (three normal and three tumoral) of the colon tissue array obtained from three different patients. From each patient, a sample pair of normal and tumoral tissues was obtained to avoid inter-patient variability, in order to optimize this novel methodology. All the tumoral samples corresponded to moderately differentiated adenocarcinoma and the normal samples from the adjacent normal mucosa. This study was approved by the Institutional Review Board of CHU Reims. 2.2.Fourier Transform Infrared (FTIR) Image AcquisitionThe methodology for IR imaging of a tissue array is shown in Fig. 1. Three- and 10 μm thick adjacent microtome sections were cut from the tissue array block. While the 3-μm section was used by the pathologist for conventional histopathological analysis via HPS staining, the first 10 μm section was used for IR imaging analysis and the second for additional histopathological comparison. The HPS stained sections were chemically deparaffinized while the adjacent 10 μm paraffinized unstained tissue section was mounted on an IR compatible calcium fluoride () window. This was directly imaged without deparaffinization, by an IR imaging system (Spotlight 300, Perkin Elmer, Courtaboeuf, France) equipped with nitrogen-cooled 16-element MCT detector at a pixel size of 6.25 μm and spectral resolution of , averaged to 16 scans, in the mid-IR range of 750 to . These acquisition parameters provided good quality data with good enough spatial and spectral resolutions for tissue investigation. The instrument and the sample compartment were continuously purged with dry air and parameters like relative humidity and water vapor were kept constant throughout the image acquisition time. The background spectrum from the window, acquired prior to image acquisition, was subtracted from the dataset automatically. Each tissue array-IR image of one circular spot (3 mm in diameter) consisted of around 130,000 spectra, and each pixel element of 6.25 μm contained a full spectrum. Fig. 1Infrared spectral imaging methodology of colon tissue arrays. A paraffinized tissue array core is imaged directly by infrared imaging system that constitutes the unprocessed infrared spectral image, which harbors a full spectrum at each pixel size of 6.25 μm, using a conventionally stained image as a morphological reference. 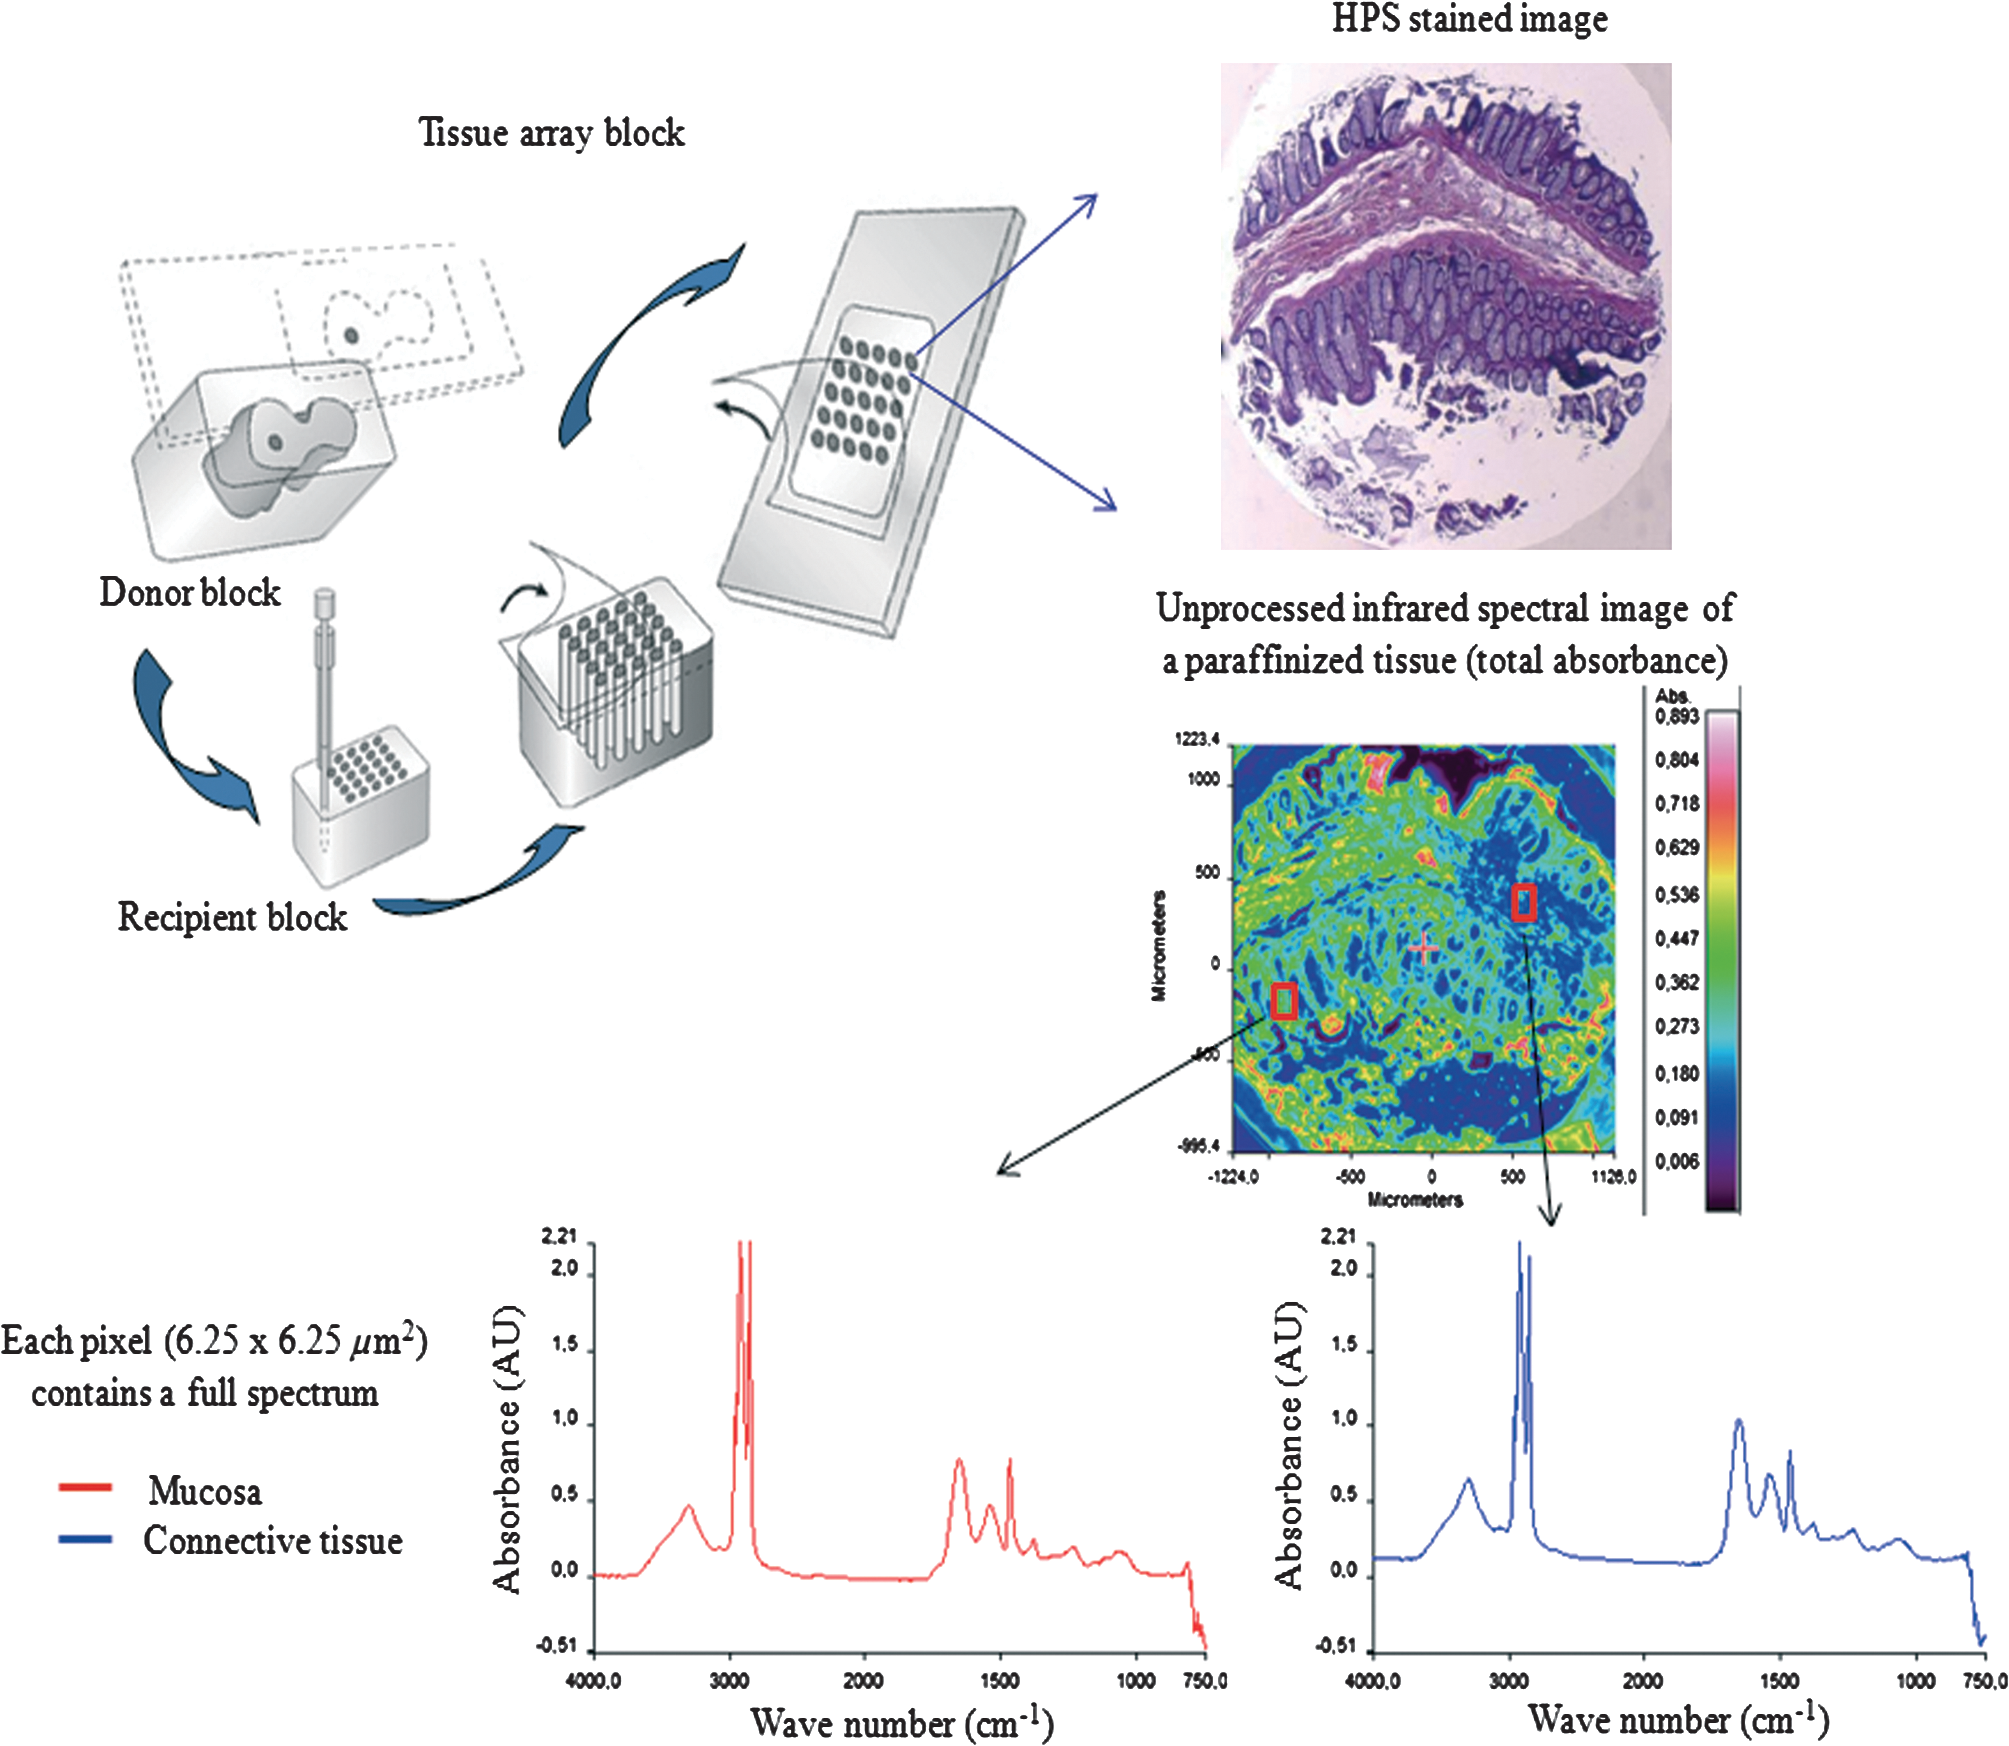 2.3.Preprocessing of IR SpectraThe spectra from the IR images included atmospheric absorptions of water vapor and , chemical absorptions of paraffin and agarose, and biochemical absorptions from the tissue itself. In order to preserve only the biochemical information, stringent preprocessing steps were employed to neutralize the contributions of noninformative spectra. For this, atmospheric correction was performed to remove contribution from water vapour and by the built-in software of Spectrum Image (Perkin Elmer). Further analyses were performed using in-house algorithms written in Matlab 7.2 (The Mathworks, Natick, MA). EMSC was used for correcting paraffin, agarose, and baseline, followed by normalization. Preprocessing, processing, and analysis of the IR spectra were carried out on spectral images in the IR absorption range of 900 to considered as the most informative region19,20 as far as the tissue features are concerned. 2.4.Construction of EMSC ModelEMSC was developed initially to correct the spectra from the physical light scattering effects that are different from the chemical light absorbance effects.21,22 IR spectra of paraffinized colon tissue array sections, along with the biochemical information originating from the tissue, showed absorption bands of paraffin ( and around ) and agarose ( and minor peaks at , , and ) in the 900 to spectral region (Fig. 2; box 1). For efficient classification and understanding of the biochemical nature of the tissue, the variability of these contributions (paraffin and agarose) had to be reduced and their influence circumvented, for which EMSC algorithm was employed in this novel approach as shown in the form of a flowchart in Fig. 2, box 2. According to our previous study23 EMSC models linearly each spectrum of the data set as: where, is the ’th acquired spectrum of the data set, i.e., a vector composed of points, is the target spectrum that is chosen as the mean spectrum of the studied dataset, is the interference matrix composed of components, is the transpose of the Vandermonde matrix of the wavenumbers ; this matrix is used to compute , a -order polynomial function modeling for the baseline, is the model error vector, is the scalar fitting coefficient of to , is the vector of the fitting coefficients of to , is the vector of the fitting coefficients of to and represents the coefficients of the -order polynomial function.Fig. 2EMSC preprocessing. Box 1: (a) Average IR spectra of paraffin; (b) paraffin and agarose together; (c) a paraffinized colon tissue array section, which includes spectral information from tissue, paraffin, and agarose, in the spectral range of 900 to . Box 2: Flowchart of the EMSC protocol. Interference matrix 1 constructed from pure paraffin spectra () and modeled into EMSC is employed on paraffin-agarose spectra to neutralize the paraffin influence and retain only the agarose spectra. Interference matrix 2 is constructed from the paraffin corrected agarose spectra () and modeled into EMSC. Interference matrices 1 and 2 are then employed on the tissue spectra to neutralize both paraffin and agarose influences and retain only the biochemical information. Box 3: Comparison of the application of EMSC, with and without paraffin and agarose corrections, by -means clustering of an FTIR spectral image (left panel). EMSC corrected pixels are colored in white. Corresponding cluster centroids (middle panel) and the dendrogram (right panel) show the differences due to the influence of spectral interferences (paraffin, agarose, and other interferences represented by clusters 2, 5, 8, and 9).  The coefficients , , and are estimated by the traditional least squares method in order to minimize the model error . The corrected spectra could be then represented by the equation The aim of EMSC is to estimate the model coefficients , , and in order to minimize the error , knowing , , and . EMSC can also be viewed as a fitting of the recorded spectra on the mean spectrum. Thus the biochemical differences of different pixel spectra are modeled in the error . The interference matrix and the Vandermonde matrix are uniquely used in the EMSC model to adjust the paraffin and agarose signals and baseline of the recorded spectra to the mean spectrum. The EMSC protocol has been used to realize several corrections; first, it corrects spectra from paraffin and agarose contributions. Second, it corrects spectra for light scattering effects, and third, it normalizes spectra on the mean spectrum . Briefly, in order to achieve these corrections, an IR image consisting of 13,516 spectra was acquired from 10 μm thick paraffin (used for tissue embedding in our laboratory) section using the same spectral parameters as that of the TMA images. Principal component analysis (PCA) was performed on these spectra to model them with orthogonal components best explaining the variability of paraffin. The interference matrix of model Eq. (1) was constructed by retaining the first 10 principal components (PCs) and the mean spectrum of paraffin. Another IR image consisting of 15,872 spectra was acquired from a 10 μm-thick section of a mixture of paraffin and agarose, as agarose is a semisolid matrix (at 2% used for TMA construction) and could not be sectioned alone. The spectra of this image were then modeled using Eq. (1) in which a fourth order polynomial function is assumed to construct to model baseline. Paraffin contributions were then neutralized from agarose, by application of correction Eq. (2). Next, PCA was performed on these paraffin corrected agarose spectra in order to model the IR signal of agarose. The first 10 significant PCs and the mean spectrum of agarose were then added to the interference matrix . is thus composed of 11 components modeling paraffin and 11 components modeling agarose. being constructed and a fourth-order polynomial function being still assumed for , the model Eq. (1) was applied to the colon IR spectral images acquired from the biopsies. The entire data set was then corrected from the contributions of paraffin and agarose, baseline corrected and normalized on the entire spectral range using Eq. (2). Furthermore, a thresholding of and permitted to detect the outlier spectra (spectra with a low value and a high value, which correspond to spectra with high paraffin and agarose contributions or spectra with a poor tissue contribution) of paraffin and agarose, and to eliminate them from further analysis. In the -means clustered images, the pixels corresponding to these outliers are colored white.2.5.Image ClusteringThe large numbers of IR spectra from each image were partitioned using an unsupervised -means clustering method owing to its capability of rapid and huge data clustering.24 This method iteratively partitions the spectra into different classes based on the spectral signatures. First, spectra ( is the number of searched clusters) are randomly chosen to represent initial centroids which model the mean spectrum of each cluster. Second, each spectrum is affected to the cluster with the nearest centroid according to the Euclidean distance. Third, each centroid is updated as the mean of the spectra belonging to its cluster. Steps 2 and 3 are repeated until the convergence of the algorithm. Therefore spectra with similar biological characteristics fall into the same cluster and spectra with dissimilar biological characteristics fall into different clusters. The spectral distance between different -means cluster centroids was visualized via a dendrogram obtained by hierarchical clustering analysis using Ward’s linkage algorithm. In -means, each spectrum belongs to a unique cluster and can thus be represented by a unique color distinct from those of the remaining clusters and a color coded image can be reconstructed for rapid and simple visual analysis of clustering results. These were then compared to adjacent HPS stained sections to annotate each spectral cluster to the tissue structural feature that it belongs to by an expert pathologist. 2.6.Statistical TestsKruskal-Wallis (KW) test was performed on individual spectra from two clusters, and the wavenumbers that were significantly discriminant () were retained. These are shown as grey bars in the Fig. 3(a). In parallel, PCA, one of the commonly used spectral data processing method, was applied on the same two clusters (mean-centered data) for validation of the KW observations and better visualization of the spectral separation. Fig. 3Discrimination of tissue features obtained by the Kruskal-Wallis test and validated by PCA between the following pair-wise comparisons: normal crypts with adenocarcinoma (left panel); adenocarcinoma with the associated stroma (middle panel); lamina propria with submucosa (right panel). The most discriminant spectral wavenumbers between the compared clusters identified by the Kruskal-Wallis test () are represented as gray bars. They are superimposed by PCA loadings showing the two PCs with the highest explained variance (a). The PCA score plot showing the separation between the compared clusters (b).  3.Results3.1.Neutralization of Paraffin and Agarose Contributions Using EMSCSpectral interferences from paraffin and agarose were estimated and corrected on the colonic tissues. Figure 2; box 3 shows a representative -means cluster image before and after the application of the correction model for paraffin and agarose. In the unprocessed image constructed using 10 clusters, spectra corresponding to these outlier spectra were seen around the tissue array sample spot (Fig. 2; box 3; top panel). Clustering analysis of this unprocessed image showed less accurate correlation with the adjacent HPS stained reference image [the HPS-stained reference image is shown in Fig. 4(a), left panel] and features such as the colonic epithelium could not be deciphered accurately even when increasing the number of clusters (data not shown). The cluster centroids showed the contribution of outliers to the image (specifically clusters 2, 5, 8, and 9), which is also reflected in the dendrogram that separates the tissue features from the outliers (Fig. 2; box 3; top panel). In the EMSC corrected image, all the outlier spectra mostly corresponding to the paraffin and agarose contributions are retrieved from the data analysis and are shown as white pixels, which can be found around, and within the clefts of the tissue array sample spot (Fig. 2; box 3; bottom panel). The resulting high degree of correlation of the FTIR image using eight clusters to the HPS-stained reference image is shown in Fig. 4(a), which demonstrates the importance of neutralizing the spectral interferences. Fig. 4-means clustering of FTIR spectral images (middle panel) with the respective dendrograms (right panel) compared to the HPS-stained colon tissue sections (left panel). Normal colonic tissue section (a) partitioned using eight clusters representing the major normal colonic tissue features by random pseudo-colors. The representation is as follows: Cluster 1: lamina propria; cluster 2: mucus; cluster 4: submucosa; clusters 6 and 7: crypts (central and the peripheral parts); cluster 8: blood vessel and other undefined tissue. Clusters 3 and 5: extra mucus structures. A moderately differentiated adenocarcinoma of a colon tissue section (b) partitioned using 14 clusters representing the major tumoral tissue features by random pseudo-colors. The representation is as follows: Cluster 8 represents tumor-associated stroma, and cluster 12 represents tumor epithelial component. Remaining clusters are not attributed to any histological class. Scale bar indicates 500 μm. 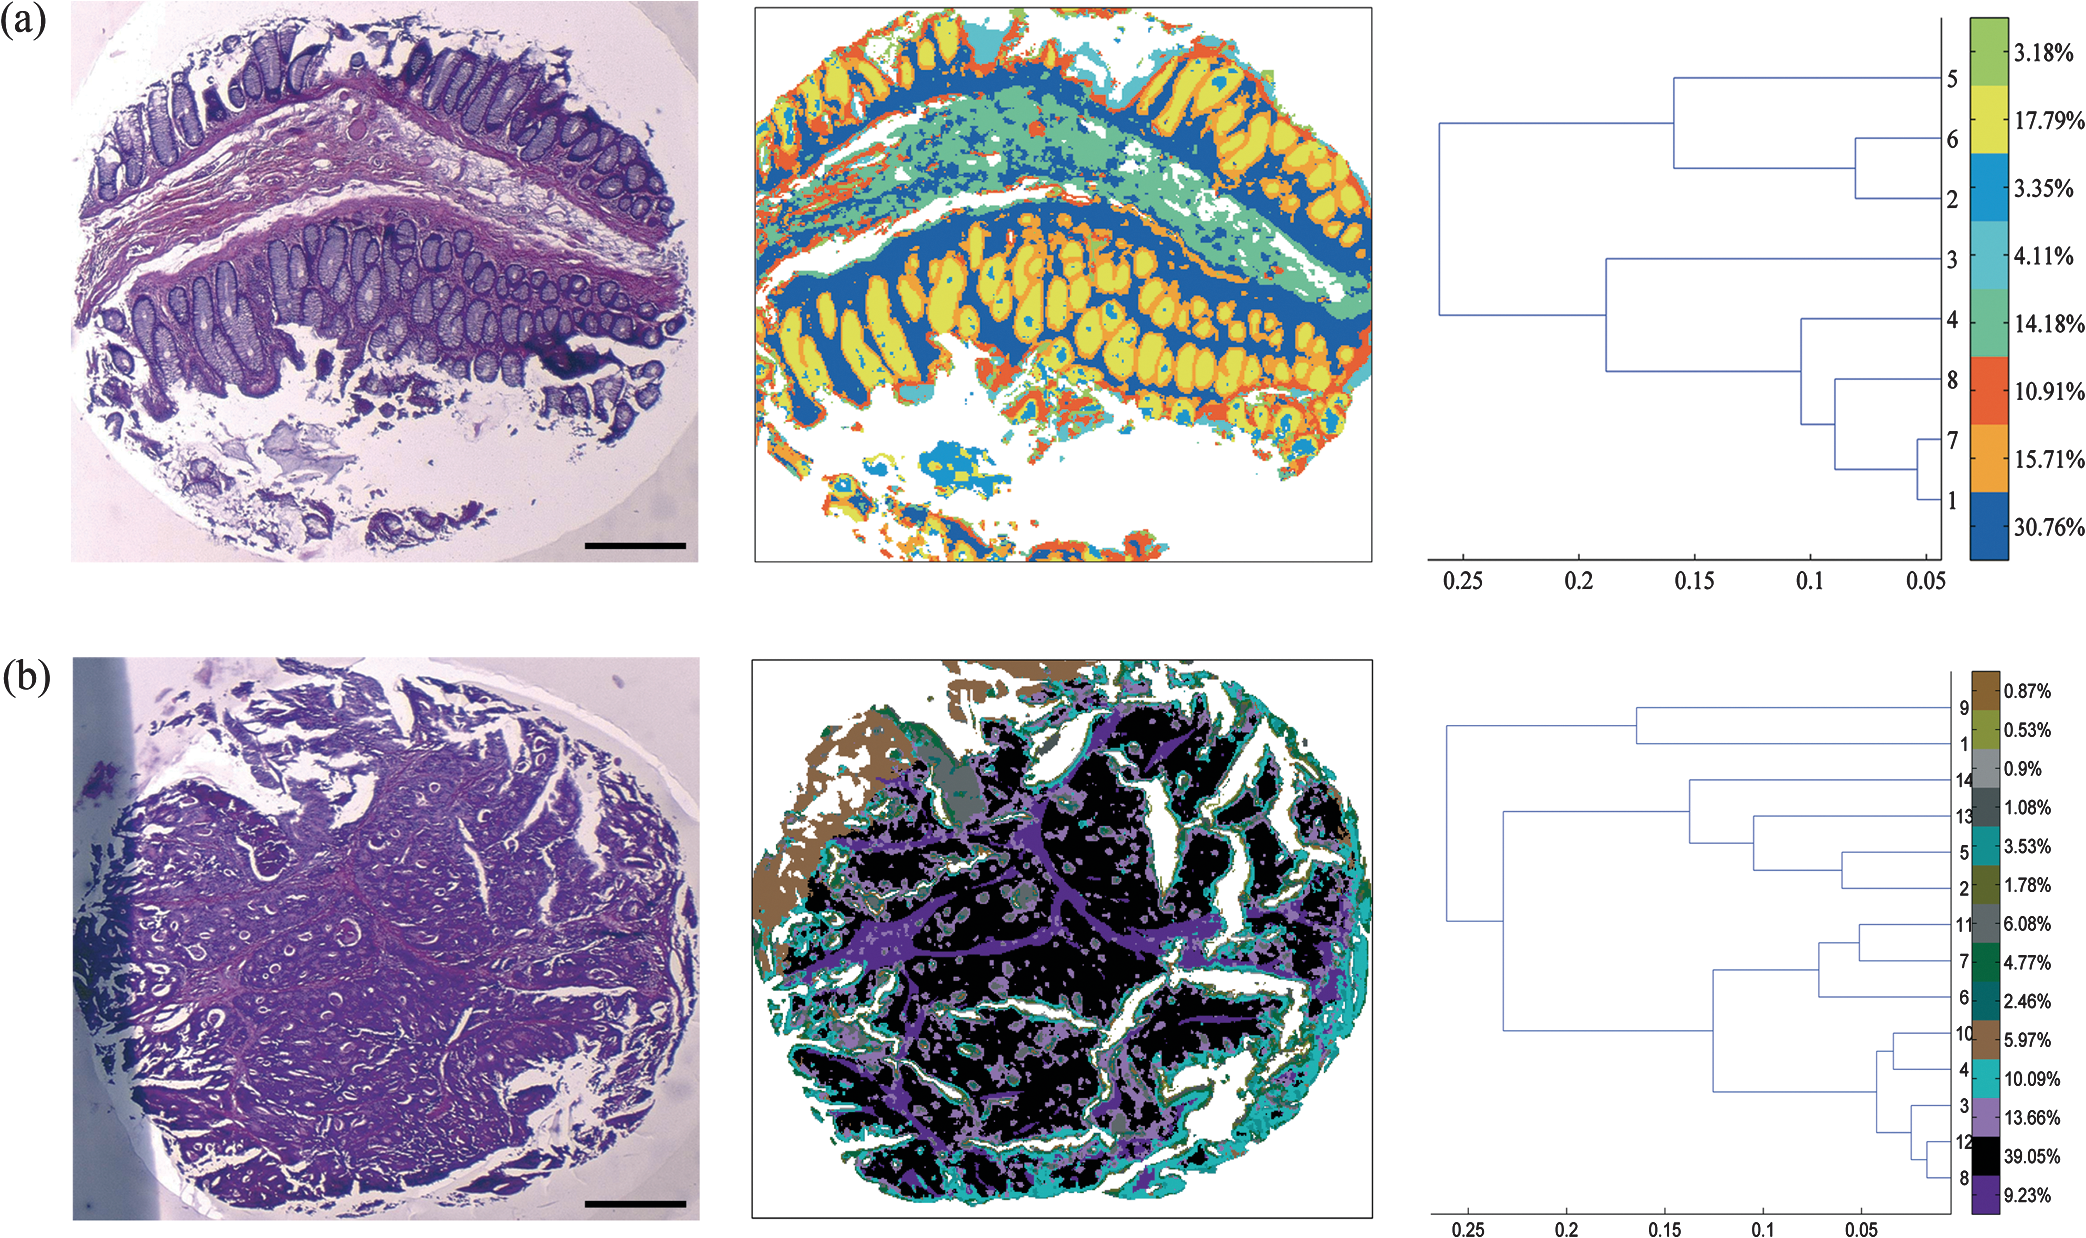 Further, as presented in Fig. 5, it was tested if the better partition of the -means image is due to EMSC or just outlier removal. In this, the outlier spectra (corresponding to pure paraffin and agarose spectra, and spectra with low signal to noise ratio as represented in white pixels) were identified by EMSC, and were removed from the data set. Then -means clustering was performed on the remaining spectra: 1. With EMSC and without the model for paraffin and agarose [Fig. 5(a)]; and 2. Without EMSC and without the model for paraffin and agarose [Fig. 5(b)]. In both cases, the correlation between the -means images and the reference HPS image [Fig. 4(a)] was less in comparison to Fig. 2, box 3 (bottom), in which EMSC is performed with the paraffin and agarose model and where a better correlation is obtained. In this circumstance, the centroids and the dendrograms also remain unexploitable. Fig. 5Comparison of different EMSC parameters without the outlier spectra. Comparison of the -means clustered images (a) with EMSC and without the model for paraffin and agarose; and (b) without EMSC and without the model for paraffin and agarose. Corresponding cluster centroids and the dendrogram are shown in the middle and the right panels respectively. The outlier spectra (corresponding to pure paraffin and agarose spectra, and spectra with low signal to noise ratio as represented in white pixels) are identified by EMSC and are removed from the data set prior to the clustering analysis.  It has to be noted that although the IR tissue spectra still exhibited the characteristic paraffin and agarose bands ( and around for paraffin and, and minor peaks at and for agarose), the influence of their spectral variability is neutralized in the clustering scheme by EMSC. Therefore the EMSC model does not completely remove the spectral features of paraffin and agarose, but neutralizes them. Thus, in the image analysis by chemometric methods, only the biochemical information is taken into account. The signals from paraffin and agarose are disregarded. Along with the neutralization of intra-sample variability arising from paraffin and agarose contributions, the inter-sample variability is avoided by using a single common target spectrum (the average spectrum on which the spectra are fitted) for all the samples. 3.2.IR Image ClusteringAfter EMSC correction, -means clustering was employed to partition the spectra of paraffinized normal and tumoral colonic tissue sections. Figure 4(a) and 4(b) show the corresponding -means images of these samples partitioned into eight and 14 clusters, respectively. These cluster numbers permitted to retrieve the principal histological structures, when compared to the HPS stained images. For example, as shown in Fig. 4(a), it was possible to identify mucosa of the normal colon that comprises of; the lamina propria (cluster 1), the loose connective tissue in which the crypts are organised; crypts (cluster 6 and 7) comprising the central part and the peripheral parts, the functional glands of a colon composed of various epithelial cell populations like goblet cells, absorptive cells, endocrine cells, or stem cells. Mucus (cluster 2) as seen in the crypt lumen and also secreted out of the crypts, submucosa (cluster 4) the fibrous connective tissue usually rich in collagen, and the blood vessels (cluster 8) in the submucosa, were also identified. Finally, clusters 3 and 5 present in minute percentage were not assigned to any specific histological structure and seem to represent extra mucus structures (appear on the periphery of the mucosa, or tired out mucosa). The spectral distances between the eight cluster centroids are computed and shown in the form of a dendrogram (Fig. 4, right panel). In the case of tumoral tissue, characterization by spectral imaging was illustrated in a sample of moderately differentiated colon adenocarcinoma as shown in Fig. 4(b). -means clustering using 14 clusters permitted to highlight two informative clusters: one attributed to the epithelial component (cluster 12) and the other to tumor-associated stroma (cluster 8). The latter, clearly demarcated from tumor, necessitated a minimum of 14 clusters to be segregated out of the tumor. The close spectral signature of the epithelial component to its associated stroma is clearly demonstrated by the corresponding dendrogram. Increasing the number of clusters did not provide any further exploitable information for spectral histology. The -means clustering results of the other samples used in the study are shown in Fig. 6. Note that a common color-code is used for histologically attributed classes, while random colors are used for histologically unattributed classes. Fig. 6-means clustering of FTIR spectral images (middle panel) with the respective dendrograms (right panel) compared to the HPS-stained colon tissue sections (left panel). The histologically attributed clusters are color coded using Fig. 4 as reference, and the unattributed structures are represented by random colors. Normal colonic tissue sections (a) and (c) are clustered using 11 and 9 clusters respectively representing the major normal colonic tissue features. The representation for the normal tissues is as follows: (a) Cluster 1: muscularis propria; clusters 2, 5, 6, and 7: submucosa; cluster 4: lamina propria; clusters 8, 9, and 10: crypts (central and peripheral parts); clusters 3 and 11: undefined tissue; (c) Cluster 2: lamina propria; clusters 3, 6, and 8: crypts (central and peripheral parts); clusters 4 and 5: submucosa, clusters 1, 7, and 9: undefined tissue. The moderately differentiated colon adenocarcinoma tissue sections (b) and (d) are clustered using 11 and 14 clusters, respectively, representing the major tumoral tissue features by random pseudo-colors. The representation for the tumoral tissues is as follows: (b) clusters 2: tumor epithelial component, and cluster 9: tumor-associated stroma; (d) cluster 5: mucin; clusters 13: tumor epithelial component; and cluster 12: tumor-associated stroma. Remaining clusters are not attributed to any histological class. Scale bar indicates 500 μm. 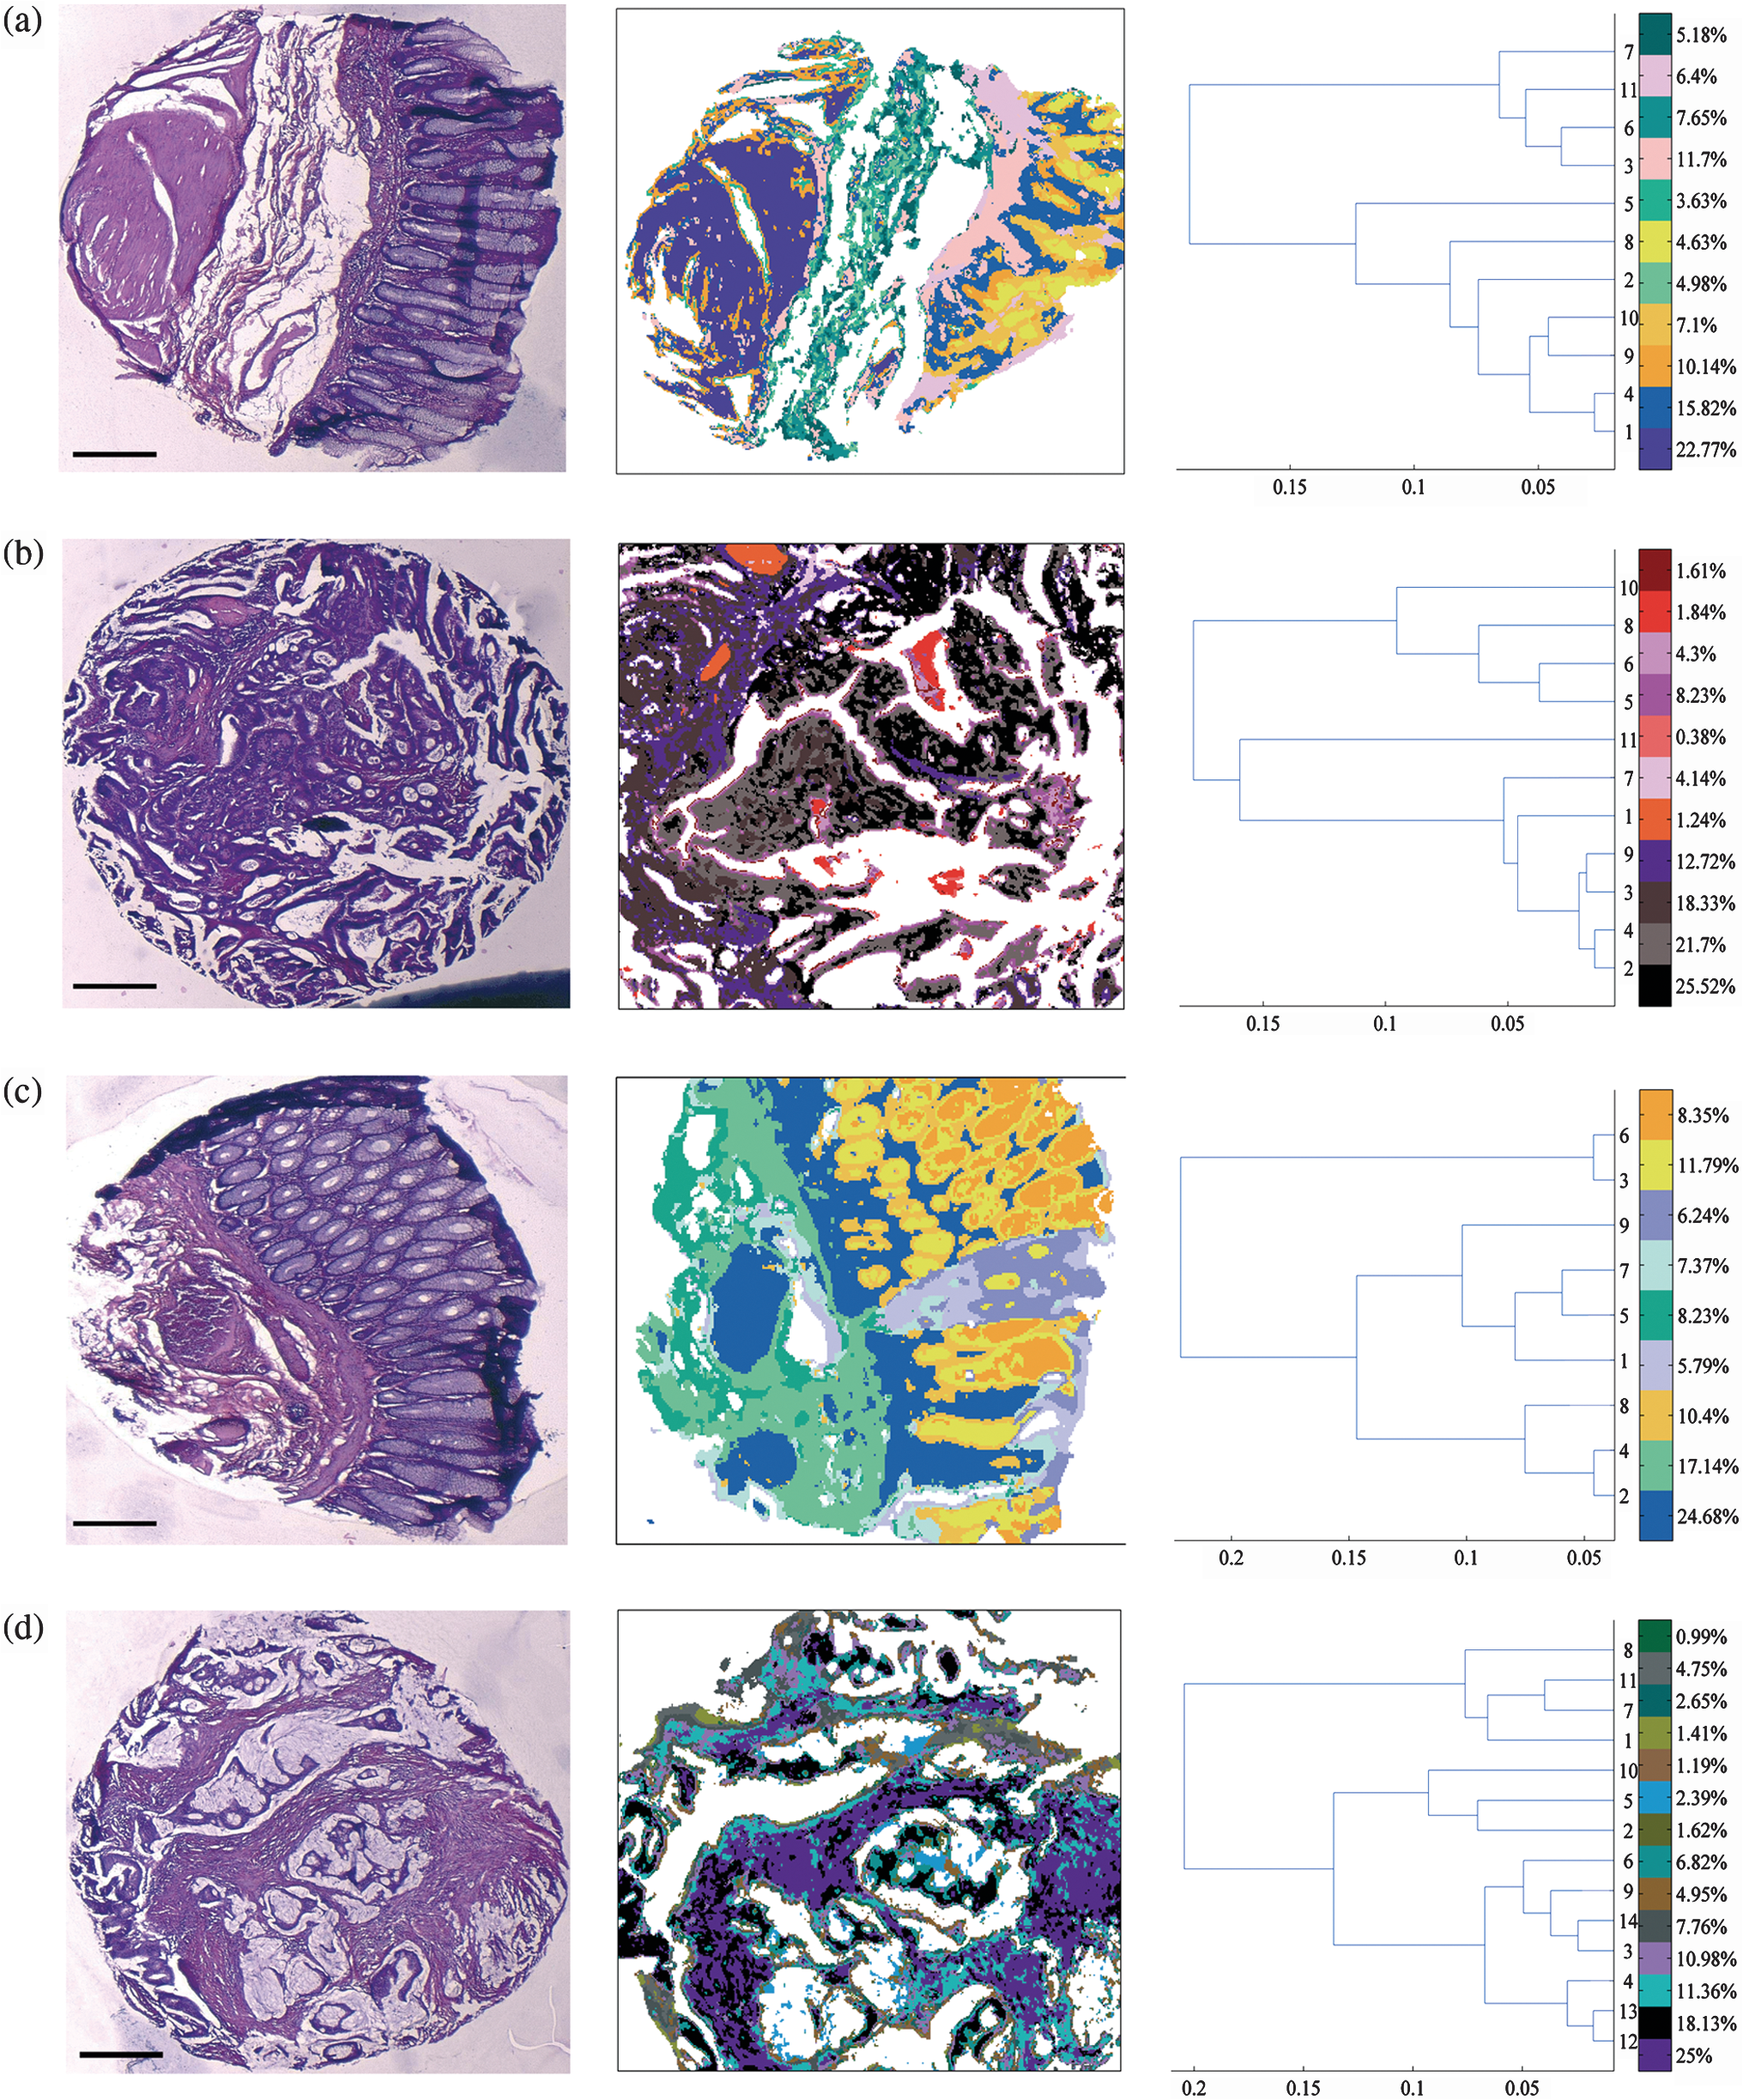 3.3.From Spectral Data to Biomolecular Level InformationFrom the -means images, it was possible to assign specific spectral signatures to histological structures that were then exploited to gain insight into the biomolecular characteristics of the normal and the tumoral colonic tissues. For this, statistical data processing using the KW test was performed on individual spectra from two clusters of interest each time, to find the spectral differences. As an example, the spectra corresponding to the normal crypts from all the normal samples [Figs. 4(a), 6(a), and 6(c)] were grouped together as normal crypts, and the spectra corresponding to the adenocarcinoma from all the tumoral samples [Figs. 4(b), 6(b), and 6(d)] were grouped together as adenocarcinoma. Then the KW test was performed, on all the spectra, between these two groups. Other comparisons including the adenocarcinoma with the associated stroma and lamina propria with submucosa were carried out in the same way. Complementarily, PCA was also performed to confirm these differences by considering the two first principal components (PC1 and PC2) that carried the highest explained variance. Figure 3(a) shows the most discriminating spectral regions identified by the KW test (grey bars) superimposed over the PCA loadings for the following pair-wise comparisons: normal crypts with adenocarcinoma corresponding to the epithelial components (left panel); adenocarcinoma with the associated stroma, which is the seat of the changes associated with the tumor environment during carcinogenesis and progression (middle panel); and in the normal tissue, lamina propria with submucosa (right panel). The discriminant wavenumbers identified by KW test corresponded principally to the first PC that was found to be visually the most discriminant in the pair-wise comparisons of right and left panels, and the second PC that was most discriminant in pair-wise comparison of the middle panel, as also represented in the PCA score plots in Fig. 3(b). The most clear-cut discrimination as shown in the score plot of Fig. 3(b), left panel (in the form of separation between the two clouds) was observed between the normal crypts and adenocarcinoma that reflect the overall biochemical alterations in this malignancy. When comparing the adenocarcinoma cluster with its associated stroma (middle panel), or the lamina propria and the submucosa (right panel), the separation is possible but with some spectral overlapping between the clouds. From the wavenumbers identified as discriminant by the KW test for all comparisons, we have tentatively attempted to correlate some of the IR vibrations to the biomolecular information contained in the colonic tissues as shown in Table 1. At the same time, the PC scores and loadings were also exploited to interpret the differences of spectral intensities between the compared classes. As an example, in the case where the first PC is the most discriminant [Fig. 3(b), left panel], the spectra are mathematically approximated by the first PC loading weighted by the first PC score. Thus the representative peak at (amide I region) of the first PC loading and the first PC scores of adenocarcinoma being positive, their product is positive and hence correspond to higher spectral intensity. On the contrary, the PC scores of the normal crypts being negative their product with the positive peak at of the first PC loading is negative and, hence, represents a decrease of spectral intensity. This spectral difference attribution becomes more complex when there is more than one discriminant PC as several PCs can have an opposing contribution to the peak intensity. Table 1Infrared spectral peak attribution.
For the normal crypts and the adenocarcinoma, the discriminant spectral features were particularly attributed to symmetric and asymmetric stretching vibrations of nucleic acids, which exhibited relatively higher intensities in the normal crypts. Other differences included those originating from the phospholipids ( stretching vibrations); and those from the carbohydrates ( stretching vibrations). These signals were relatively more intense in normal crypts than in adenocarcinoma while the opposite tendency was observed for the amide I band of proteins. The hydrogen bonded groups of proteins in the normal tissue was seen to decrease in the tumoral tissue. It was examined if the discrimination potential of the methodology between the normal and the tumoral tissues is influenced by the tumor type with respect to certain biomolecules. For this, the spectra originating from the tumor and the secreted mucin clusters, of one of the tumoral samples that was mucinous adenocarcinoma were compared with the spectra from the nonmucinous regions of the normal crypts (crypt periphery) of the same patient. The statistical analysis revealed appearance of mucin peaks (, ) as discriminant vibrations that were of high intensity in the tumoral tissue as shown in the Fig. 7. When comparing adenocarcinoma and tumor-associated stroma, the discriminating spectral features corresponded to collagen features, and amide II of proteins. For lamina propria and submucosa clusters, the amide regions of proteins appeared to contribute to the discriminant wavenumbers. Fig. 7Discrimination of tissue features obtained by the Kruskal-Wallis test and validated by PCA between the pair-wise comparisons of normal crypt periphery with mucinous tumor. The most discriminant spectral wavenumbers between the compared clusters identified by the Kruskal-Wallis test () are represented as gray bars. They are superimposed by PCA loadings showing the two first PCs with the highest explained variance (a). The PCA score plot showing the separation between the compared clusters (b).  4.DiscussionVery few studies have combined IR imaging with tissue microarray (TMA) technology,27,28 and none have involved direct analysis of the paraffinized tissue arrays or tissue arrays stabilized in an agarose matrix.29 This study is a first attempt to apply IR spectral imaging to a paraffinized tissue array stabilized in an agarose matrix, without any chemical deparaffinization, for comparing normal and tumoral colonic tissue samples. Along with the reduction in the tissue preparation steps, an additional advantage of IR imaging on paraffin embedded and agarose stabilized tissues is that the scattering effects due to the differences in the refractive indices are reduced by index matching. EMSC initially developed to correct light scattering effects,21,22 and water vapor and carbon dioxide,30 has also been previously implemented by our group to neutralize paraffin contributions in paraffinized tissues.23,31,32 In this study, it was employed for the first time, a step ahead to neutralize spectral interferences from both paraffin and agarose, projecting EMSC as a “custom-made correction method,” which could be adapted to correct a variety of spectral interferences and permit to test tissues in different embedding materials. -means clustering of the EMSC corrected IR spectral images allowed identification of various histological structures of the normal and the tumoral colonic tissues. The colonic tissue structures like the lamina propria, the submucosa, the crypts, and the blood vessels were easily identified in the normal histological and the spectral images. The spectral signatures associated with the biomolecular differences between these histological groups were highlighted by the KW test and confirmed by PCA analysis. In the normal tissue, -means clustering differentiated well between the lamina propria and the submucosa, which are both connective tissues. Based on the multivariate statistical analyses, the biomolecular discrimination can be associated to the changes in the spectral profiles of the amide regions of proteins. Normal crypts are the functional glands of the colonic mucosa, where the molecular transformations in the event of carcinogenesis take place. The -means cluster image allowed to clearly distinguish both the central and the surrounding nuclear part of the epithelial glands and the lamina propria in which the glands were organized. In the case of malignant tissue, the crypts were no longer well differentiated, and no particular cluster could be attributed to either the central or the nuclear part. The mucosal structures were no longer individualized, and only two components could be distinguished: the epithelial one and the associated stroma. By comparing the normal crypts and the adenocarcinoma, surprisingly the IR spectra of normal crypts were associated with relatively higher intensities of nucleic acids than in the adenocarcinomatous epithelial component. This is in contrast to other studies that have showed increased nucleic acid intensities in tumoral samples when compared to the normal samples.9 Another study has shown decreased intensity of asymmetric stretch of nucleic acids in tumoral tissue while increased intensity of symmetric stretch of nucleic acids.33 One of the possibilities for this observation is likely that the spectral alterations involving nucleic acids are less marked since the normal colon cells themselves are highly proliferative and have a high mitotic rate, and, in tumors that are moderately differentiated, the cellular proliferation is only slightly increased.24 Interestingly, there are also studies that have shown that the spectral differences observed between a normal and a tumoral tissue actually may correspond to the differences originating from the different phases of cell cycles, since the opacity of DNA to IR radiation is based on the cell cycle phase which is related to the DNA packing and condensing.34 Usually, the normal colon crypts are rich in mucin. However, its corresponding peaks were not discriminatory when all the normal and the tumoral samples were compared. This could be explained from the fact that the presence of a mucinous tumor diminishes the spectral differences between the mucin rich normal crypts and the tumoral tissues. Interestingly, in comparison of the mucinous adenocarcinoma tissue with the nonmucinous regions of the normal crypts, mucin corresponding peaks reappeared as discriminant features. These results, which corroborated with the histopathology show the ability of IR spectroscopy in identifying biomolecular changes in respect to the analyzed tissue types based on the spectral characteristics. The identification of subtle changes involving mucin could be used to characterize tumor types in colon cancers. The same tendency of higher intensities was observed for carbohydrate and phospholipids between the normal and the tumoral tissues. On the other hand, higher amide I intensities were associated with adenocarcinoma probably indicating greater accumulation of proteins during carcinogenesis and progression. Another interesting observation arises from changes in the relative intensities of the vibrations involving the H-bonded and non-H-bonded bond vibrations of proteins. While the former is more pronounced in the normal tissues, the latter is more in the tumoral tissues. Similar changes have been observed in earlier studies on colon cancers that probably indicate the molecular changes associated with the amino acid side chains involving tyrosine, serine, and threonine.25,26,33 Finally, the observed difference in the spectral profiles of nucleotides, proteins, phospholipids, and carbohydrates, between the benign and the malignant tissues appears as an interesting discriminating feature in moderately differentiated colon cancers. The IR spectral region around 1000 to contains vibrational bands from several biomolecules like nucleotides, carbohydrates, mucin etc. Additionally, agarose, which although is found only around the tissue array cores, have signatures in this region, which does make the analysis of the data sets more complicated. For characterizing the tumoral tissue [Fig. 4(b)], 14 clusters were necessary to identify the tumor together with its associated stroma. These two clusters showed very close spectral profiles, an observation that supports the view that stroma is intimately associated to its tumor. In spite of this, the highly sensitive statistical methods enabled to depict subtle differences that could be probably associated with the spectral profiles of collagen features together with the amide II regions of the proteins, and other stroma-associated proteins in malignancy. 5.ConclusionThis study demonstrates the potential of IR spectral imaging for identifying and differentiating various histological features of normal and tumoral paraffin-embedded colon tissue arrays. An important aspect is that large spots (3 mm diameter) of the paraffinized tissue array stabilized in an agarose matrix could be directly analyzed without chemical dewaxing thus simplifying the experimental protocol. This procedure was enabled by the implementation of an optimized version of the EMSC algorithm permitting to numerically neutralize both paraffin and agarose spectral contributions. Additionally, using multivariate analysis, complementary information on the changes associated with the biochemical properties between normal and malignant tissues could be also recovered, in a single measurement and in a label-free manner. The translation of this methodology of IR imaging is envisaged to paraffinized tissue microarrays that can enable high-throughput, molecular level analysis of large tissue archives. These optimistic results open a new way for developing spectral biomarkers and libraries, which could be used, in complement to conventional histopathology, for early diagnosis and also potentially for prognosis and theranostics of cancers. AcknowledgmentsThis study was supported by a grant of Institut National du Cancer (INCa) and Canceropôle Grand Est. We would like to thank Ligue contre le Cancer, Conférence de Coordination Interrégionale du Grand-Est, and CNRS Projets Exploratoires Pluridisciplinaires, for financial support. NJ is a recipient of doctoral fellowship from the Région Champagne-Ardenne. ReferencesF. L. Martinet al.,
“Distinguishing cell types or populations based on the computational analysis of their infrared spectra,”
Nat. Protoc., 5
(11), 1748
–1760
(2010). http://dx.doi.org/10.1038/nprot.2010.133 1754-2189 Google Scholar
R. K. Sahuet al.,
“Detection of abnormal proliferation in histologically ‘normal’ colonic biopsies using FTIR-microspectroscopy,”
Scand. J. Gastroenterol., 39
(6), 557
–566
(2004). http://dx.doi.org/10.1080/00365520410004695 SJGRA4 0036-5521 Google Scholar
P. Laschet al.,
“Characterization of colorectal adenocarcinoma sections by spatially resolved FT-IR microspectroscopy,”
Appl. Spectros., 56
(1), 1
–9
(2002). http://dx.doi.org/10.1366/0003702021954322 APSPA4 0003-7028 Google Scholar
A. Tfayliet al.,
“Discriminating nevus and melanoma on paraffin-embedded skin biopsies using FTIR microspectroscopy,”
Biochim. Biophys. Acta, 1724
(3), 262
–269
(2005). http://dx.doi.org/10.1016/j.bbagen.2005.04.020 BBACAQ 0006-3002 Google Scholar
H. Fabianet al.,
“Diagnosing benign and malignant lesions in breast tissue sections by using IR-microspectroscopy,”
Biochim. Biophys. Acta, 1758
(7), 874
–882
(2006). http://dx.doi.org/10.1016/j.bbamem.2006.05.015 BBACAQ 0006-3002 Google Scholar
W. Stelleret al.,
“Delimitation of squamous cell cervical carcinoma using infrared microspectroscopic imaging,”
Anal. Bioanal. Chem., 384
(1), 145
–154
(2006). http://dx.doi.org/10.1007/s00216-005-0124-4 ABCNBP 1618-2642 Google Scholar
A. Travoet al.,
“IR spectral imaging of secreted mucus: a promising new tool for the histopathological recognition of human colonic adenocarcinomas,”
Histopathology, 56
(7), 921
–931
(2010). http://dx.doi.org/10.1111/his.2010.56.issue-7 HISTDD 1365-2559 Google Scholar
M. J. Nasseet al.,
“High-resolution Fourier-transform infrared chemical imaging with multiple synchrotron beams,”
Nat. Methods, 8
(5), 413
–416
(2011). http://dx.doi.org/10.1038/nmeth.1585 1548-7091 Google Scholar
M. J. Germanet al.,
“Infrared spectroscopy with multivariate analysis potentially facilitates the segregation of different types of prostate cell,”
Biophys. J., 90
(10), 3783
–3795
(2006). http://dx.doi.org/10.1529/biophysj.105.077255 BIOJAU 0006-3495 Google Scholar
K. Yanoet al.,
“Direct measurement of human lung cancerous and noncancerous tissues by Fourier transform infrared microscopy: can an infrared microscope be used as a clinical tool?,”
Anal. Biochem., 287
(2), 218
–225
(2000). http://dx.doi.org/10.1006/abio.2000.4872 ANBCA2 0003-2697 Google Scholar
T. D. Wanget al.,
“Detection of endogenous biomolecules in Barrett’s esophagus by Fourier transform infrared spectroscopy,”
Proc. Natl. Acad. Sci. U. S. A., 104
(40), 15864
–15869
(2007). http://dx.doi.org/10.1073/pnas.0707567104 PNASA6 0027-8424 Google Scholar
X. Zhanget al.,
“Intraoperative detection of thyroid carcinoma by Fourier transform infrared spectrometry,”
J. Surg. Res., 171
(2), 650
–656
(2010). http://dx.doi.org/10.1016/j.jss.2010.05.031 JSGRA2 0022-4804 Google Scholar
C. Krafftet al.,
“Classification of malignant gliomas by infrared spectroscopic imaging and linear discriminant analysis,”
Anal. Bioanal. Chem., 387
(5), 1669
–1677
(2007). http://dx.doi.org/10.1007/s00216-006-0892-5 ABCNBP 1618-2642 Google Scholar
E. O. Faolainet al.,
“Raman spectroscopic evaluation of efficacy of current paraffin wax section dewaxing agents,”
J. Histochem. Cytochem., 53
(1), 121
–129
(2005). http://dx.doi.org/10.1177/002215540505300114 JHCYAS 0022-1554 Google Scholar
J. Ferlayet al.,
“Estimates of worldwide burden of cancer in 2008: GLOBOCAN 2008,”
Int. J. Cancer, 127
(12), 2893
–2917
(2010). http://dx.doi.org/10.1002/ijc.v127:12 IJCNAW 1097-0215 Google Scholar
H. Miyoshiet al.,
“Accuracy of detection of colorectal neoplasia using an immunochemical occult blood test in symptomatic referred patients: comparison of retrospective and prospective studies,”
Intern. Med., 39
(9), 701
–706
(2000). http://dx.doi.org/10.2169/internalmedicine.39.701 IEDIEP 0918-2918 Google Scholar
D. K. Rex,
“Colon tumors and colonoscopy,”
Endoscopy, 32
(11), 874
–883
(2000). ENDCAM 0013-726X Google Scholar
T. J. Zuber,
“Flexible sigmoidoscopy,”
Am. Fam. Physician, 63
(7), 1375
–1380
(2001). AFPYAE 0002-838X Google Scholar
M. Khanmohammadiet al.,
“Diagnosis of colon cancer by attenuated total reflectance-Fourier transform infrared microspectroscopy and soft independent modeling of class analogy,”
Med. Oncol., 26
(3), 292
–297
(2009). http://dx.doi.org/10.1007/s12032-008-9118-3 MONCEZ 1357-0560 Google Scholar
M. Khanmohammadiet al.,
“Application of linear discriminant analysis and attenuated total reflectance Fourier transform infrared microspectroscopy for diagnosis of colon cancer,”
Pathol. Oncol. Res., 17
(2), 435
–441
(2011). http://dx.doi.org/10.1007/s12253-010-9326-y 1219-4956 Google Scholar
H. MartensJ. P. NielsenS. B. Engelsen,
“Light scattering and light absorbance separated by extended multiplicative signal correction: application to near-infrared transmission analysis of powder mixtures,”
Anal. Chem., 75
(3), 394
–404
(2003). http://dx.doi.org/10.1021/ac020194w ANCHAM 0003-2700 Google Scholar
A. Kohleret al.,
“Extended multiplicative signal correction as a tool for separation and characterization of physical and chemical information in Fourier transform infrared microscopy images of cryo-sections of beef loin,”
Appl. Spectros., 59
(6), 707
–716
(2005). http://dx.doi.org/10.1366/0003702054280649 APSPA4 0003-7028 Google Scholar
E. Lyet al.,
“Combination of FTIR spectral imaging and chemometrics for tumour detection from paraffin-embedded biopsies,”
Analyst, 133
(2), 197
–205
(2008). http://dx.doi.org/10.1039/b715924b ANLYAG 0365-4885 Google Scholar
P. Laschet al.,
“Imaging of colorectal adenocarcinoma using FT-IR microspectroscopy and cluster analysis,”
Biochim. Biophys. Acta, 1688
(2), 176
–186
(2004). http://dx.doi.org/10.1016/j.bbadis.2003.12.006 BBACAQ 0006-3002 Google Scholar
F. P. Conti Cet al.,
“FT-IR microimaging spectroscopy: a comparison between healthy and neoplastic human colon tissues,”
J. Mol. Struc., 881 46
–51
(2008). http://dx.doi.org/10.1016/j.molstruc.2007.08.040 JMOSB4 0022-2860 Google Scholar
S. L. PatrickT. T. WongH. M. Yazdi,
“Normal and malignant human colonic tissues investigated by pressure-tuning FT-IR spectroscopy,”
Appl. Spectros., 47
(11), 1830
–1836
(1993). Google Scholar
D. C. Fernandezet al.,
“Infrared spectroscopic imaging for histopathologic recognition,”
Nat. Biotechnol., 23
(4), 469
–474
(2005). http://dx.doi.org/10.1038/nbt1080 NABIF9 1087-0156 Google Scholar
J. T. Kwaket al.,
“Analysis of variance in spectroscopic imaging data from human tissues,”
Anal. Chem., 84
(2), 1063
–1069
(2012). http://dx.doi.org/10.1021/ac2026496 ANCHAM 0003-2700 Google Scholar
P. Schramlet al.,
“Tissue microarrays for gene amplification surveys in many different tumor types,”
Clin. Cancer Res., 5
(8), 1966
–1975
(1999). 1078-0432 Google Scholar
S. W. Bruunet al.,
“Correcting attenuated total reflection-Fourier transform infrared spectra for water vapor and carbon dioxide,”
Appl. Spectros., 60
(9), 1029
–1039
(2006). http://dx.doi.org/10.1366/000370206778397371 APSPA4 0003-7028 Google Scholar
D. Sebiskveradzeet al.,
“Automation of an algorithm based on fuzzy clustering for analyzing tumoral heterogeneity in human skin carcinoma tissue sections,”
Lab. Invest., 91
(5), 799
–811
(2011). http://dx.doi.org/10.1038/labinvest.2011.13 LAINAW 0023-6837 Google Scholar
R. Wolthuiset al.,
“IR spectral imaging for histopathological characterization of xenografted human colon carcinomas,”
Anal. Chem., 80
(22), 8461
–8469
(2008). http://dx.doi.org/10.1021/ac801191x ANCHAM 0003-2700 Google Scholar
B. Rigaset al.,
“Human colorectal cancers display abnormal Fourier-transform infrared spectra,”
Proc. Natl. Acad. Sci. U. S. A., 87
(20), 8140
–8144
(1990). http://dx.doi.org/10.1073/pnas.87.20.8140 PNASA6 0027-8424 Google Scholar
S. Boydston-Whiteet al.,
“Infrared spectroscopy of human tissue. V. Infrared spectroscopic studies of myeloid leukemia (ML-1) cells at different phases of the cell cycle,”
Biospectroscopy, 5
(4), 219
–227
(1999). http://dx.doi.org/10.1002/(ISSN)1520-6343 BIOSFS 1075-4261 Google Scholar
|
||||||||||||||||||||||||||||||||||||||||||||||||||||||||||||||||||||||||||||||||||||||


