
|
|
1.IntroductionThe Stiles–Crawford effect (SCE) states that luminance efficiency is dependent on incident light direction relative to the eye axis.1 It is well established that the retina is more sensitive to light entering the center of the pupil, i.e., parallel light relative to eye axis, than light passing through the periphery, i.e., oblique light illumination. The SCE is exclusively observed in cones, which can benefit good vision quality by suppressing intraocular stray light under photopic conditions.2 In contrast, the SCE has not been detected in rods, which dominate scotopic vision.2 In other words, the absorption efficiency of light by rods was not affected by the incident angle in early SCE studies which were performed with psychophysical methods.2 The biophysical mechanisms underlying this rod/cone difference are not established. In this study, we conducted dynamic near infrared (NIR) light imaging to explore transient changes in rod and cone photoreceptors activated by oblique light stimuli. High-spatial (micrometers) and high-temporal (milliseconds) resolution NIR imaging revealed that 80% of rods could rapidly move toward the direction of oblique stimulus light while such directional movement was negligible in cones. Our experimental results suggest that transient phototropic adaptation may quickly compensate for the loss of luminous efficiency in rods activated by oblique stimulation, which can explain the absence of the SCE in the rod system. The observed transient phototropic adaptation of retinal rods not only provides insight into the nature of vision but also promises an intrinsic optical signal (IOS) biomarker. This would enable noninvasive, high-resolution assessment of rod function, which is known to be more vulnerable than cone function in aging and early age-related macular degeneration (AMD),3,4 the most common cause of severe vision loss and legal blindness in adults over 50.3,5 2.Materials and Methods2.1.Retina PreparationAnimal handling was approved by the Institutional Animal Care and Use Committee of the University of Alabama at Birmingham. Both frog (Rana pipiens) and mouse (Mus musculus) retinas were used to demonstrate the transient phototropic adaptation in the retina. Frog retinas were selected as primary specimens in this study for several reasons. First, the relatively large size of frog (compared to mouse or other mammalian) photoreceptors allows unambiguous observation of individual photoreceptors. Second, the diameter of frog rods ( to 8 μm) is much larger than cones ( to 3 μm),6,7 and thus, rod and cone photoreceptors can be easily separated based on their cellular diameters. Third, rod and cone numbers are roughly equal in frog retinas,6,7 and thus, unbiased analysis of rod and cone cells can be readily achieved. Preparation procedures of fresh living whole-mount frog retinas have been reported in previous publications.8 Briefly, the frog was euthanized by rapid decapitation and double pithing. After enucleating the intact eye, we hemisected the globe below the equator with fine scissors. The lens and anterior structures were removed before the retina was separated from the retinal pigment epithelium. Mouse retinas were used to verify the transient phototropic adaptation in mammalians. Five-month-old wild-type mice, which have been maintained for more than 20 generations from an original cross of C57Bl/6J to 129/SvEv, were used in this study. The rd1 allele that segregated in the 129/SvEv stock was removed by genetic crossing and verified as previously described.9 Protocols for handling mouse samples were previously reported.10 Briefly, after the eyeball was enucleated from anesthetized mice, the retina was isolated from the eyeball in Ames media and then transferred to a recording chamber. During the experiment, the sample was continuously superfused with oxygenated bicarbonate-buffered Ames medium, maintained at pH 7.4 and 33°C to 37°C. 2.2.Experimental SetupThe imaging system was based on a NIR digital microscope that has been previously used for functional imaging of living retinal tissues.10 A fast digital camera (Neo sCMOS, Andor Technology, Belfast, UK) with pixel size was used for retinal imaging. A water immersion objective with 0.5 NA was used for frog experiments. Therefore, the lateral resolution of the system was about 1 μm (). For mouse experiments, we used a water immersion objective with 0.75 NA which has the lateral resolution of 0.7 μm. The system consisted of two light sources: a NIR (800 to 1000 nm) light for retinal imaging and a visible (450 to 650 nm) light-emitting diode (LED) for retinal stimulation. The duration of the visible flash was 5 ms. Figure 1 illustrates rectangular stimulus patterns with oblique incident angles [Fig. 1(a)] and a circular stimulus pattern with perpendicular incident angle [Fig. 1(b)]. Figures 1(a) and 1(b) were used for the experiments in Figs. 2 and 4, and Fig. 3, respectively. All images of retinas in this article were acquired at . Fig. 1Schematic diagram of stimulation patterns. O: objective; and R: retina. Black dash lines indicate the normal axis of retinal surface. Red solid lines indicate the incident directions. Top panels are cross-section view (transverse or plane) and the bottom panels are enface view (axial or plane). (a1) Rectangular stimulus (bottom panel) with 30-deg incident angle with respect to the normal axis of retinal surface (top panel). (a2) Rectangular stimulus (bottom panel) with incident angle (top panel). (b) Circular stimulus (bottom panel) with 0-deg incident angle (top panel). The retina was placed with the ganglion cell layer facing toward the objective. 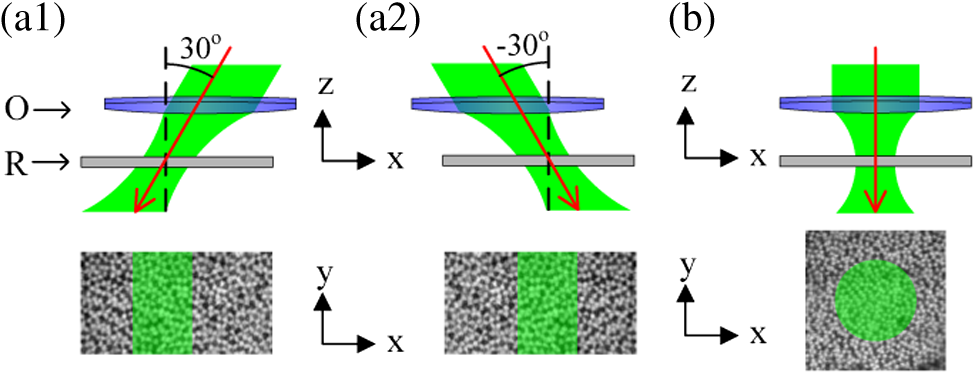 Fig. 2Oblique stimulus-evoked photoreceptor displacements. (a) Near infrared (NIR) image of frog photoreceptor mosaic pattern. Green dashed window illustrates stimulus area. Red rectangle indicates the area shown in Video 1 (QuickTime, 7.7 MB) [URL: http://dx.doi.org/10.1117/1.JBO.18.10.106013.1] which displays a pair of pre- and poststimulus images alternating repeatedly 20 times. Red and green arrows point to rods and cones, respectively. (b) Average displacement of 25 rods and cones which were randomly selected from the stimulus area. The gray shadow indicates the standard deviation. (c) Active ratios of rods and cones at time 200 ms after the onset of the stimulus. Six trials were used. For each trial, 25 rods and cones were randomly selected. Thus, in each trial, the active ratio was calculated as the number of active rods or cones divided by 25. (d) Retinal displacements associated with the 30-deg stimulus [Fig. 1(a1)] at 200 ms. Dynamic changes of retinal displacement maps from to 1000 ms are displayed in Video 2 (QuickTime, 6.7 MB) [URL: http://dx.doi.org/10.1117/1.JBO.18.10.106013.2]. (e) Retinal displacements associated with the stimulus [Fig. 1(a2)] at 200 ms. Each square in (d) and (e) represents a area of the retina. Transient displacements within the small square were averaged.  Fig. 3Photoreceptor displacements and intrinsic optical signal (IOS) responses stimulated by circular stimulus (in transverse plane) with a Gaussian profile (in axial plane). (a) NIR image of frog photoreceptor mosaic. Red rectangle indicated the area shown in Video 3 (QuickTime, 7.9 MB) [URL: http://dx.doi.org/10.1117/1.JBO.18.10.106013.3] which displays a pair of pre- and poststimulus images alternating repeatedly 20 times. (b) Localized retinal displacements associated with circular stimulus. This stimulus had a Gaussian profile in axial plane [Fig. 1(b)]. The same methods as those in Figs. 2(e) and 2(f) were used here to produce the displacement maps. (c) IOS maps. reflected the light intensity change and was the background light intensity. Zone 1 corresponds to the area within the inner ring. Zone 2 corresponds to the annular area. The stimulus was delivered at time 0. (d) Enlarged view of b3. (e) Enlarged view of c3. Scale bars indicate 100 μm. (f) Dynamic change of the number of active pixels in (b). The pixel with nonzero value was defined as active. (g) Temporal IOS profiles.  2.3.Dynamic Calculation of Individual Photoreceptor MovementsIn order to quantify transient phototropic changes in rod and cone systems, we calculated the displacement of individual rods [Figs. 2(b) and 4(b)] and cones [Fig. 2(b)].The level-set method11 was used to identify the morphological edge of individual rods and cones. Then, the weight centroid was calculated dynamically, allowing accurate registration of the location of individual photoreceptors at nanometer resolution. The same strategy has been used in stochastic optical reconstruction microscopy12 and photoactivated localization microscopy13,14 to achieve nanometer resolution to localize individual molecules with photoswitchable fluorescence probes. The three-sigma rule was used to set up a threshold to distinguish silent and active photoreceptors.10 If the stimulus-evoked photoreceptor shifted above this threshold, then this photoreceptor was defined as active. Otherwise, it was defined as silent. Thus, the active ratio of the rods and cones could be obtained [Fig. 2(c)]. 2.4.Computer Algorithm of Localized Retinal MovementsThe activated photoreceptors were displaced due to light stimulations [Figs. 2(c), 2(d), and 3(b)]. In order to quantify the photoreceptor displacements, the normalized cross correlation (NCC) between the poststimulus and prestimulus images was calculated to estimate localized retinal movements. We assume that was the image acquired at the time point of , where was the image index and was the pixel position. We took the first image as the reference image. For the pixel at the position of from the image , there would be a horizontal shift (parallel to the axis) and a vertical shift (parallel to the axis) compared to the reference image. At the position of from the image , we took a subwindow ( pixels): where and . Here, we set (corresponding to 3.9 μm at the retina). This window is at the level of individual cells (cone: 5 to 8 μm and rod: 1 to 3 μm). We selected a corresponding subwindow of the reference image at the position of :Then the correlation coefficient could be calculated between two image matrices defined by Eqs. (1) and (2): where was the mean of the matrix , and was the mean of the matrix . We searched from to , and from to , where was the searching size, set to be 3 (corresponding to 0.9 μm at the retina) here. Thus, we could find the position , where the value of correlation coefficient defined by Eq. (3) was maximum. Therefore, the horizontal shift (parallel to axis) and vertical shift (parallel to axis) at the position were obtained as:They could be rewritten as a complex number where is the imaginary unit, is the shift amplitude map [the color images in Figs. 2(d), 2(e), and 3(b)] and is the direction map [directions of arrows in Figs. 2(d), 2(e), and 3(b)].If then the pixel was displaced, thus defined as active. Therefore, the active pixel numbers could be plotted as a function of the time [Fig. 3(f)].2.5.IOS Data ProcessingIn order to test the effect of the phototropic adaptation on the IOS pattern associated with circular stimulus, representative IOS images are illustrated in Fig. 3(c), with a unit of , where is the background light intensity and reflects the light intensity change corresponding to retinal stimulation. Basic procedures of IOS data processing have been previously reported.8 3.Results3.1.Transient Phototropic Adaptation in Frog Retina Activated by Oblique StimulationFigure 2 shows results of phototropic adaptation correlated with oblique light stimulation. Figure 2(a) shows the photoreceptor mosaic pattern. Individual rods [red arrows in Fig. 2(a)] and cones [green arrows in Fig. 2(a)] could be observed. A rectangular stimulus with a 30 deg incident angle [Fig. 1(a1)] was delivered to the retina. Within the stimulation area, photoreceptor displacements were directly observed in NIR images (Video 1). In order to quantify transient phototropic changes in rod and cone systems, we calculated displacements of individual rods and cones (see Sec. 2). Figure 2(b) shows average displacements of 25 rods and cones randomly selected from the stimulus window. The displacement of rods occurred almost immediately () and reached a magnitude peak at . The magnitude of rod displacement (average: 0.2 μm, with maximum up to 0.6 μm) was significantly larger than that of cone displacement (average: 0.048 μm, with maximum of 0.15 μm). In addition, as shown in Fig. 2(c), the active ratio (see Sec. 2 for definition) of rods was , while of cones were activated. The observation indicated that the transient phototropic displacement was dominantly observed in rods. In order to verify directional dependency of the phototropic adaptation, we used template matching with the NCC to compute nonuniform motion in the retina (see Sec. 2).15 As shown in Video 2 and Fig. 2(d), the stimulus-activated retina shifted to right, i.e., toward the direction of the 30-deg oblique stimulation. In order to confirm the reliability of the phototropic response, the incident angle of the stimulus was switched to [Fig. 1(a2)], 5 min after the recording illustrated in Fig. 2(d). Figure 2(e) illustrates the transient movement corresponding to stimulus at the same retinal area shown in Fig. 2(d). It was observed that the stimulated retina shifted toward the left [Fig. 2(e)], i.e., in the opposite direction compared to Fig. 2(d). Comparative recording of the 30 and stimuli verified that transient photoreceptor movement was tightly dependent on the incident direction of the stimulus light. 3.2.Transient Phototropic Adaptation in Frog Retina Activated Oblique Stimulation by Circular (Transverse) Stimulation with a Gaussian (Axial) ProfileIn addition to the aforementioned oblique stimulation, Fig. 3 shows transient photoreceptor displacements activated by a perpendicular circular stimulus with a Gaussian profile in the axial plane [Fig. 1(b)]. The circular aperture was conjugate to the focal plane of the imaging system. It is well known that cones taper toward the outer segment (OS) and are shorter than rods,6 which implies that the OS pattern should have relatively larger extracellular space between photoreceptors when compared to the inner segment (IS) pattern. Therefore, when the tight mosaic pattern of photoreceptors [Fig. 2(a)] was clearly observed, the focal plane was around the photoreceptor IS. Hence, at the more distal position, i.e., the OS, the stimulus light was divergent and became oblique at the edge. However, at the central area, the stimulus light impinged the photoreceptor without directional dependence. Under this condition, only photoreceptors at the periphery of the stimulus pattern underwent displacement, which can be directly visualized in Video 3. Figures 3(b) and 3(d) not only confirmed this phenomenon but also revealed that peripheral photoreceptors shifted toward the center. The number of active pixels [see Eq. (7)] was plotted over time in Fig. 3(f). The rapid displacement occurred almost immediately () after the stimulus delivery, reached the magnitude peak at , and recovered at . It was consistently observed that the stimulus-evoked displacement was rod dominant. Utilizing the same methods employed in Fig. 2(c), rod and cone displacements were quantitatively calculated. Within the annular area in Fig. 3(d), 25 rods and cones were randomly selected for quantitative comparison. of rods were activated, whereas of cones were activated at 200 ms after the onset of stimulus (six samples). 3.3.Correlation of Transient Phototropism and IOS in Frog RetinaWe speculated that the transient phototropic changes may partially contribute to stimulus-evoked IOSs, which promised a noninvasive method for spatiotemporal mapping of retinal function.8,16 IOS images shown in Fig. 3(c) confirmed the effect of IOS enhancement at the edge of the circular stimulus. The edge-enhanced IOS response gradually degraded over time, which was consistent with the change of the photoreceptor displacement [Fig. 3(b)]. In addition, both positive and negative IOS signals, with high magnitude, were observed at the periphery of the stimulus pattern. In contrast, the IOS signal at the stimulus center [Zone 2, Fig. 3(e)] was positive dominant, and the IOS magnitude was weaker than that observed at peripheral area [Zone 1, Fig. 3(e)]. Moreover, time courses of IOS responses were different between Zone 1 and Zone 2 [Fig. 3(g)]. The central IOS curve [black curve in Fig. 3(g)] more resembled the curve of the active pixel number [Fig. 3(f)], which suggested that transient phototropic change primarily contributes to the periphery IOSs. 3.4.Transient Phototropic Adaptation in Mouse Retina Activated by Oblique StimulationIn order to verify the transient phototropic changes in mammalians, we have conducted a preliminary study of mouse retinas with oblique stimulation. Unlike large frog photoreceptors (rod: to 8 μm, cone: to 3 μm), mouse photoreceptors (1 to 2 μm for both rods and cones) are relatively small.17,18 Although individual mouse photoreceptors [Fig. 4(a)] were not as clear as frog photoreceptors [Figs. 2(a) and 3(a)], we selected representative individual mouse photoreceptors [arrows in Fig. 4(a)], which could be unambiguously isolated from others. Figure 4(b) shows temporal displacements of 10 mouse photoreceptors pointed out in Fig. 4(a). These 10 photoreceptors shifted to the left [arrows in Fig. 4(b)]. Figure 4(c) shows an average magnitude of photoreceptor displacements. As shown in Fig. 4(c), the displacement occurred within 5 ms and reached the peak at 30 ms. Fig. 4Stimulus-evoked photoreceptor displacements at the mouse retina. (a) NIR image of mouse photoreceptor mosaic. A objective with 0.75 NA was used. The image size corresponds to a area at the retina. The green dashed rectangle indicates the oblique stimulation area. (b) Displacments of 10 photoreceptors over time. The stimulus was delivered at time 0. These 10 photoreceptors were specified by arrows in (a). Green arrows in circles indicate the direction of the displacement at time 30 ms after stimulation. (c) Averaged displacement of 10 photoreceptors. The inset panel shows the same data within the time period from to 0.1 s. 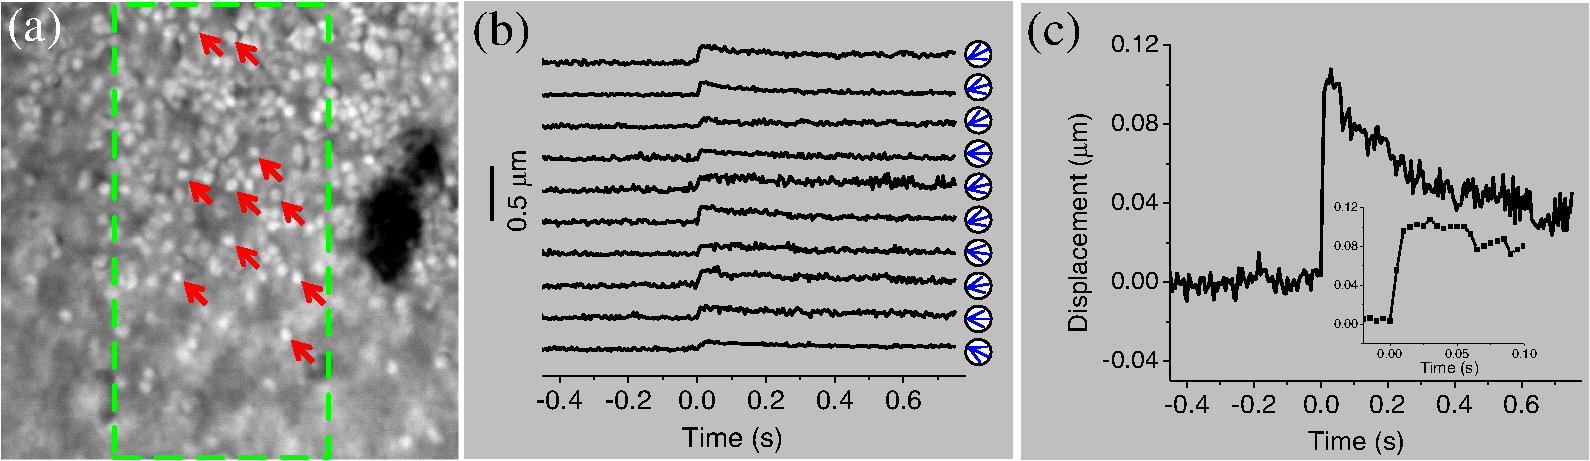 4.DiscussionIn summary, high-spatial and temporal-resolution imaging revealed rod-dominant transient phototropic response in frog (Fig. 2) and mouse (Fig. 4) retinas under oblique stimuli. Such transient phototropic response could compensate for the loss of illumination efficiency under oblique stimulation in the rod system. Although the image resolution in Fig. 4(a) was not high enough to separate rods and cones reliably, we speculate that the observed displacement was rod dominated due to the established knowledge that rods account for of total number of the photoreceptors in mouse retinas.19 In contrast to rods, it can take a long time, at least tens of seconds or even days, for cone adaptation.20 In other words, rapid (onset: for frog and for mouse; time-to-peak: for frog and for mouse) phototropic adaptation in retinal rods is too quick for the SCE to be detected by conventional psychophysical methods with the advanced involvement of brain perception. Gaussian-shape stimulation further confirmed the transient rod displacement (Fig. 3). In addition, the observed off-center and on-surround pattern [Fig. 3(b)] may imply early involvement of the photoreceptors in contrast enhancement. The edge enhancement was confirmed by the IOS maps [Fig. 3(c)]. In general, it is believed that the center-surround antagonism, which is valuable for contrast perception, is initiated by horizontal cells21,22 and/or amacrine cells.23 However, our experimental results here suggest that the discrepancy of the incident angle between the surround and the center of the Gaussian illumination [Fig. 1(b)] can evoke directional displacement only at the surround [Fig. 3(b)]. Such an edge-enhanced pattern of photoreceptor activity may suggest an early involvement of the photoreceptors in contrast perception. Moreover, the observed transient rod movement provides an IOS biomarker to allow early detection of eye diseases that can cause retinal dysfunction. Rod function has been well established to be more vulnerable than cones in aging and early AMD,3,4 which is the most common cause of severe vision loss and legal blindness in adults over 50.3,5 Structural biomarkers, such as drusen and pigmentary abnormalities in the macula, are important for retinal evaluation. Adaptive optics imaging of individual rods has been recently demonstrated.24–26 However, the most commonly used tool for retinal imaging, the fundus examination, is not sufficient for a final retinal diagnosis.27 In principle, physiological function is degraded in diseased cells before detectable abnormality of retinal morphology. Psychophysical methods28–30 and electroretinography31 measurements have been explored for functional assessment of the retina, but reliable identification of localized rod dysfunctions is still challenging due to limited resolution and sensitivity. The experimental results shown in Fig. 3 indicate that the transient phototropic changes can partially contribute to IOS recording, which has the potential to be developed into a superior noninvasive method for spatiotemporal mapping of retinal function.8,10 The different time courses of the IOSs at Zone 1 (periphery) and Zone 2 (center) suggest that the phototropic change of rod photoreceptors primarily contributes to the periphery IOS response. Multiple IOS origins, including neurotransmitter secretion,32 refractive index change of neural tissues,33 interactions between photoexcited rhodopsin and guanosine triphosphate (GTP)-binding protein,34 disc shape change,35 cell swelling,36 etc., have been proposed. In order to investigate the biophysical mechanism of transient phototropic adaptation, we are currently pursuing optical coherence tomography of retinal photoreceptors to quantify the axial location of phototropic kinetics. Further investigations are also planned to quantify time courses of the transient phototropic adaptations in wild type and diseased mouse retinas. We anticipate that further investigation of the rod-dominant phototropic effect can provide a high-resolution methodology to achieve objective identification of rod dysfunction, thereby allowing early detection and easy treatment evaluation of eye diseases, such as AMD-associated photoreceptor degeneration. AcknowledgmentsThis research is supported in part by NSF CBET-1055889, NIH R21 EB012264, UASOM I3 Pilot Award and NEI R01 EY018143-05. The authors wish to thank Dr. Christine Curcio and Dr. Walter Makous for their valuable comments and constructive suggestions on the manuscript, we thank Delores W. Davis in Dr. Pittler’s laboratory for providing the mice and relevant genotype and age information. ReferencesW. S. StilesB. H. Crawford,
“The luminous efficiency of rays entering the eye pupil at different points,”
Proc. R. Soc. Lond., 112
(778), 428
–450
(1933). http://dx.doi.org/10.1098/rspb.1933.0020 PRLBA4 0080-4649 Google Scholar
G. Westheimer,
“Directional sensitivity of the retina: 75 years of Stiles-Crawford effect,”
Proc. Biol. Sci., 275
(1653), 2777
–2786
(2008). http://dx.doi.org/10.1098/rspb.2008.0712 PRLBA4 0080-4649 Google Scholar
C. A. CurcioN. E. MedeirosC. L. Millican,
“Photoreceptor loss in age-related macular degeneration,”
Invest. Ophthalmol. Vis. Sci., 37
(7), 1236
–1249
(1996). IOVSDA 0146-0404 Google Scholar
C. Owsleyet al.,
“Cone- and rod-mediated dark adaptation impairment in age-related maculopathy,”
Ophthalmology, 114
(9), 1728
–1735
(2007). http://dx.doi.org/10.1016/j.ophtha.2006.12.023 OPANEW 0743-751X Google Scholar
N. M. BresslerS. B. BresslerS. L. Fine,
“Age-related macular degeneration,”
Surv. Opthalmol., 32
(6), 375
–413
(1988). http://dx.doi.org/10.1016/0039-6257(88)90052-5 SUOPAD 0039-6257 Google Scholar
S. E. Nilsson,
“An Electron Microscopic Classification of the Retinal Receptors of the Leopard Frog (Rana Pipiens),”
J. Ultrastruct. Res., 10
(5), 390
–416
(1964). http://dx.doi.org/10.1016/S0022-5320(64)80018-6 JULRA7 0022-5320 Google Scholar
P. A. LiebmanG. Entine,
“Visual pigments of frog and tadpole (Rana pipiens),”
Vis. Res., 8
(7), 761
–775
(1968). http://dx.doi.org/10.1016/0042-6989(68)90128-4 VISRAM 0042-6989 Google Scholar
X. C. YaoY. B. Zhao,
“Optical dissection of stimulus-evoked retinal activation,”
Opt. Express, 16
(17), 12446
–12459
(2008). http://dx.doi.org/10.1364/OE.16.012446 OPEXFF 1094-4087 Google Scholar
S. J. PittlerW. Baehr,
“Identification of a nonsense mutation in the rod photoreceptor cGMP phosphodiesterase beta-subunit gene of the rd mouse,”
Proc. Natl. Acad. Sci. U.S.A., 88
(19), 8322
–8326
(1991). http://dx.doi.org/10.1073/pnas.88.19.8322 PNASA6 0027-8424 Google Scholar
Q. X. Zhanget al.,
“Comparative intrinsic optical signal imaging of wild-type and mutant mouse retinas,”
Opt. Express, 20
(7), 7646
–7654
(2012). http://dx.doi.org/10.1364/OE.20.007646 OPEXFF 1094-4087 Google Scholar
C. Liet al.,
“Distance regularized level set evolution and its application to image segmentation,”
IEEE Trans. Image Process., 19
(12), 3243
–3254
(2010). http://dx.doi.org/10.1109/TIP.2010.2069690 IIPRE4 1057-7149 Google Scholar
M. J. RustM. BatesX. Zhuang,
“Sub-diffraction-limit imaging by stochastic optical reconstruction microscopy (STORM),”
Nat. Methods, 3
(10), 793
–795
(2006). http://dx.doi.org/10.1038/nmeth929 1548-7091 Google Scholar
E. Betziget al.,
“Imaging intracellular fluorescent proteins at nanometer resolution,”
Science, 313
(5793), 1642
–1645
(2006). http://dx.doi.org/10.1126/science.1127344 SCIEAS 0036-8075 Google Scholar
M. F. Juetteet al.,
“Three-dimensional sub-100 nm resolution fluorescence microscopy of thick samples,”
Nat. Methods, 5
(6), 527
–529
(2008). http://dx.doi.org/10.1038/nmeth.1211 1548-7091 Google Scholar
A. J. Hiiet al.,
“Fast normalized cross correlation for motion tracking using basis functions,”
Comput. Methods Programs Biomed., 82
(2), 144
–156
(2006). http://dx.doi.org/10.1016/j.cmpb.2006.02.007 CMPBEK 0169-2607 Google Scholar
Q. X. Zhanget al.,
“In vivo confocal intrinsic optical signal identification of localized retinal dysfunction,”
Invest. Ophthalmol. Vis. Sci., 53
(13), 8139
–8145
(2012). http://dx.doi.org/10.1167/iovs.12-10732 IOVSDA 0146-0404 Google Scholar
L. D. Carter-DawsonM. M. LaVail,
“Rods and cones in the mouse retina. I. Structural analysis using light and electron microscopy,”
J. Comp. Neurol., 188
(2), 245
–262
(1979). http://dx.doi.org/10.1002/(ISSN)1096-9861 JCNEAM 0021-9967 Google Scholar
D. MustafiA. H. EngelK. Palczewski,
“Structure of cone photoreceptors,”
Prog. Retinal Eye Res., 28
(4), 289
–302
(2009). http://dx.doi.org/10.1016/j.preteyeres.2009.05.003 PRTRES 1350-9462 Google Scholar
C. J. JeonE. StrettoiR. H. Masland,
“The major cell populations of the mouse retina,”
J. Neurosci., 18
(21), 8936
–8946
(1998). JNRSDS 0270-6474 Google Scholar
H. S. SmallmanD. I. A. MacLeodP. Doyle,
“Vision: realignment of cones after cataract removal,”
Nature, 412
(6847), 604
–605
(2001). http://dx.doi.org/10.1038/35088126 NATUAS 0028-0836 Google Scholar
F. S. WerblinJ. E. Dowling,
“Organization of the retina of the mudpuppy, Necturus maculosus. II. Intracellular recording,”
J. Neurophysiol., 32
(3), 339
–355
(1969). JONEA4 0022-3077 Google Scholar
D. A. BaylorM. G. FuortesP. M. O’Bryan,
“Receptive fields of cones in the retina of the turtle,”
J. Physiol., 214
(2), 265
–294
(1971). JPHYA7 0022-3751 Google Scholar
D. S. LebedevD. W. Marshak,
“Amacrine cell contributions to red-green color opponency in central primate retina: a model study,”
Vis. Neurosci., 24
(4), 535
–547
(2007). http://dx.doi.org/10.1017/S0952523807070502 VNEUEY 0952-5238 Google Scholar
E. A. Rossiet al.,
“Imaging retinal mosaics in the living eye,”
Eye, 25
(3), 301
–308
(2011). http://dx.doi.org/10.1038/eye.2010.221 12ZYAS 0950-222X Google Scholar
D. Merinoet al.,
“Observation of cone and rod photoreceptors in normal subjects and patients using a new generation adaptive optics scanning laser ophthalmoscope,”
Biomed. Opt. Express, 2
(8), 2189
–2201
(2011). http://dx.doi.org/10.1364/BOE.2.002189 BOEICL 2156-7085 Google Scholar
N. Dobleet al.,
“In vivo imaging of the human rod photoreceptor mosaic,”
Opt. Lett., 36
(1), 31
–33
(2011). http://dx.doi.org/10.1364/OL.36.000031 OPLEDP 0146-9592 Google Scholar
C. Owsleyet al.,
“Delays in rod-mediated dark adaptation in early age-related maculopathy,”
Ophthalmology, 108
(7), 1196
–1202
(2001). http://dx.doi.org/10.1016/S0161-6420(01)00580-2 OPANEW 0743-751X Google Scholar
R. Kleinet al.,
“The relationship of age-related maculopathy, cataract, and glaucoma to visual acuity,”
Invest. Ophthalmol. Vis. Sci., 36
(1), 182
–191
(1995). IOVSDA 0146-0404 Google Scholar
J. SiderovA. L. Tiu,
“Variability of measurements of visual acuity in a large eye clinic,”
Acta Ophthalmol. Scand., 77
(6), 673
–676
(1999). http://dx.doi.org/10.1034/j.1600-0420.1999.770613.x AOSCFV 1395-3907 Google Scholar
A. Loewensteinet al.,
“Replacing the Amsler grid: a new method for monitoring patients with age-related macular degeneration,”
Ophthalmology, 110
(5), 966
–970
(2003). http://dx.doi.org/10.1016/S0161-6420(03)00074-5 OPANEW 0743-751X Google Scholar
A. BinnsT. H. Margrain,
“Development of a technique for recording the focal rod ERG,”
Ophthalmic Physiol. Opt., 26
(1), 71
–79
(2006). http://dx.doi.org/10.1111/opo.2006.26.issue-1 OPOPD5 0275-5408 Google Scholar
B. M. SalzbergA. L. ObaidH. Gainer,
“Large and rapid changes in light scattering accompany secretion by nerve terminals in the mammalian neurohypophysis,”
J. Gen. Physiol., 86
(3), 395
–411
(1985). http://dx.doi.org/10.1085/jgp.86.3.395 JGPLAD 0022-1295 Google Scholar
R. A. Stepnoskiet al.,
“Noninvasive detection of changes in membrane potential in cultured neurons by light scattering,”
Proc. Natl. Acad. Sci. U.S.A., 88
(21), 9382
–9386
(1991). http://dx.doi.org/10.1073/pnas.88.21.9382 PNASA6 0027-8424 Google Scholar
H. Kuhnet al.,
“Interactions between photoexcited rhodopsin and GTP-binding protein: kinetic and stoichiometric analyses from light-scattering changes,”
Proc. Natl. Acad. Sci. U.S.A., 78
(11), 6873
–6877
(1981). http://dx.doi.org/10.1073/pnas.78.11.6873 PNASA6 0027-8424 Google Scholar
K. P. Hofmannet al.,
“Measurements on fast light-induced light-scattering and -absorption changes in outer segments of vertebrate light sensitive rod cells,”
Biophys. Struct. Mech., 2
(1), 61
–77
(1976). http://dx.doi.org/10.1007/BF00535653 BSMHBH 0340-1057 Google Scholar
I. TasakiP. M. Byrne,
“Rapid structural changes in nerve fibers evoked by electric current pulses,”
Biochem. Biophys. Res. Commun., 188
(2), 559
–564
(1992). http://dx.doi.org/10.1016/0006-291X(92)91092-5 BBRCA9 0006-291X Google Scholar
|


