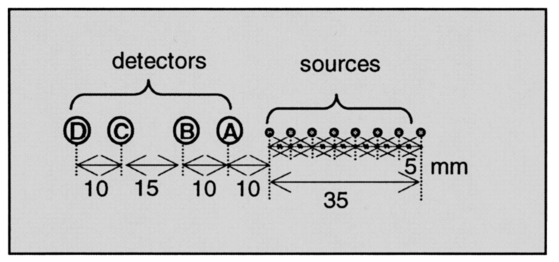
1.IntroductionThe measurement of the optical properties of the human brain may be important for several medical applications in diagnosis and therapy; for example, in monitoring the sufficiency of cerebral tissue oxygenation. The absorption coefficient (μa), the scattering coefficient (μs), and the anisotropy factor (g) of many different parts of the brain in the visible and near-infrared spectral range have been published.1 However, they have been measured in vitro and without a doubt are different from those existing in vivo, owing to a variety of physiological factors, including blood drainage, structural alterations (mitochondrial swelling), and temperature variation. The measurement of optical properties of the brain performed in vivo can be used as a diagnostic tool as well as a tool to detect brain activity, which can complement other brain activity detection methods, e.g. functional magnetic resonance imaging or positron emission tomography. Light scattering and absorption can provide information on tissue structure and chromophore contents. These features can be used to detect the structural deformation of neuronal cells as a result of neural activity or to monitor hemodynamic changes in tissue. However, in order to quantify the physiological components, such as hemoglobin concentration and its oxygen saturation or cytochrome c oxidase concentration, the absolute optical properties need to be obtained. The tissue oxygen saturation (S t O 2), one of the most crucial parameters, is calculated directly from the absorption coefficients in the near-infrared spectral region. Many researchers have proposed different methods to quantitatively determine cerebral tissue oxygenation by using time or frequency-domain near-infrared spectroscopy (fdNIRS). For example, measurements of cerebral tissue oxygenation in the adult head were performed by Quaresima et al.;2 using continuous-wave NIRS, and by Kurth and Thayer3 using frequency-domain NIRS with a single distance and a fixed scattering coefficient. The light bundle formed by a source–detector pair enters the brain after traveling through the skull. Therefore, the information from the brain is significantly mixed with the information from the scalp and skull. Considering that the cerebral tissue oxygenation (cS t O 2) is not necessarily the same as S t O 2 in the skin and skull, a layer-selective measurement is required. In this paper we distinguish the optical properties of the cerebral tissue from the upper layers. To achieve this goal, we have built a multidistance sensor in which sources and detectors are arranged linearly so that the separation between source and detector ranges from 1 to 8 cm at intervals of 0.5 cm. Franceschini et al.;4 have measured the effective absorption and reduced scattering [μs ′=(1−g)μs] coefficients of two-layered phantoms based on the diffusion equation for a semi-infinite medium with multidistance frequency-domain NIRS. They showed that μa and μs ′ of the bottom layer can be retrieved by using multiple sources, with the source–detector distance larger than a critical value. The minimum source–detector distance headed to acquire the optical properties of the bottom layer was determined experimentally. In particular, the effective optical properties for the source–detector distance in the range of 1.5 to 4.5 cm are those of the bottom layer if the thickness of the top layer is smaller than 4 mm.4 Our main goals were to determine whether the human head can be modeled as a two-layer turbid medium with an infinitely thick deeper layer, and to obtain the optical properties of the deeper layer, which in our model is the brain. The optical properties of the skin and skull are similar to each other, but are significantly different from those of the brain.5 6 7 Furthermore, the optical properties of the head can be complicated by the presence of the cerebrospinal fluid (CSF) layer between the skull and the brain. In practice, the CSF contains a considerable amount of light-scattering membranes as well as light-absorbing blood vessels with a complex geometry. Dehghani and Delpy8 have shown that the presence of such scattering and absorbing particles does not significantly increase the light penetration into the brain, whereas Ripoll et al.;9 have shown that the roughness of the interface between the nondiffusive and diffusive region diminishes the effect of the nondiffusive CSF layer on the distribution of the spatial intensity. In our measurements, the wavelength of the photon density wave is about 30 cm (the modulation frequency is 110 MHz),10 therefore our technique has a macroscopic resolution and the impact of CSF is expected to be insignificant. The theoretical framework for interpretation of photon migration in the frequency domain in terms of absorption and scattering properties was given by Fantini et al.;11 and Kienle et al.;12 based on the diffusion approximation to the Boltzman transport equation in semi-infinite and two-layer media, respectively. In this paper, we first look at the spatial profiles of the reflectance and phase delay of the modulated light that depend on the source–detector distance in the adult head. In particular, we show the sigmoidal dependence upon distance of the reduced scattering and absorption coefficients characterizing the optical properties of the scalp/skull for short optode separation distances and then mix the optical properties of both layers for intermediate distances, and finally recover the optical properties of brain for long distances. The results are analyzed in more detail by comparison with the solution of the diffusion equation in two-layer turbid media derived by Kienle et al.;12 An approach to the inverse problem, which consists of extracting optical coefficients from the reflectance and phase data, is attempted by using a nonlinear regression algorithm and fitting the solution of the two-layer diffusion model. We present the hemoglobin content and tissue oxygen saturation in the scalp/skull and brain as results of the measurements of the adult human head in vivo. 2.Theoretical Methods2.1.Multidistance Method for Obtaining Optical Properties of the Semi-infinite MediumThe propagation of light in tissue is best described by the radiative transport theory. As a result of the high scattering and low absorption of biological tissues in the near-infrared region, one can simplify the transport equation by using the diffusion approximation to the transport equation. The diffusion equation has been solved analytically for simple geometries such as infinite, semi-infinite, and two-layer media; slabs; spheres; and cylinders, providing solutions for a pointlike light source.13 Fantini et al.;11 have obtained the analytical solution for the frequency-domain parameters, such as the phase shift, mean light intensity, and modulation amplitude, as functions of the distance in a semi-infinite geometry boundary condition using the diffusion approximation. The measured phase and amplitude can be fit to the analytical solution in order to estimate μa and μs ′ for both an infinite and the semi-infinite medium. In particular, the solution yields expressions for the derivatives: where ϕ is the phase shift, M is the modulation amplitude, D is the photon diffusion coefficient defined as D=[3(μs ′+μa)]−1, ω is the angular frequency of the modulation, v is the speed of light in the medium, and ρ is the distance between the source and detector. From Eqs. (1) and (2) one can estimate μa and μs ′: where ∂ρ ln[ρ2M(ρ)] and ∂ρϕ are the slopes of modulation amplitude and phase shift with respect to ρ. Using Eqs. (3) and (4), the optical parameters μa and μs ′ can be determined directly from the values of ϕ and M measured at different ρ in the frequency domain. One benefit of these expressions is their independence from the instrumental parameters such as the laser light power, detector sensitivity, and other instrumental factors. However, since these equations were obtained under the assumption that the amplitude and initial phase are the same for each light source, an instrumental calibration must be performed to correct for any amplitude and phase inequalities.The solution of the diffusion equation for a two-layer medium in the frequency domain was derived by Kienle et al.;12 The first layer of the two-layer medium has a thickness l and the second layer is semi-infinite. The intensity, modulated amplitude, and the phase (I, M, and ϕ) can be obtained by using the equation for the spatially resolved reflectance from two-layer media R(ρ,ω), which is derived in Ref. 12. 2.2.Estimation of Physiological ParametersIn the near-infrared region, the primary chromophores in biological tissues are oxyhemoglobin and deoxyhemoglobin molecules. Depending on their oxygenation state, the absorption spectra of hemoglobins are different. Assuming that no other chromophores significantly contribute to the absorption other than oxyhemoglobin and deoxyhemoglobin, one can calculate their concentrations using the extinction coefficients at wavelength λ by applying the Beer-Lambert law: where ε O 2 Hb λ and ε O 2 Hb λ are the extinction coefficients at wavelength λ of oxy- and deoxyhemoglobin, respectively, and [O 2 Hb] and [HHb] are their concentrations. To extract the concentration of hemoglobin in both states, one can use two wavelengths (λ1 and λ2) , so thatFrom [O 2 Hb] and [HHb], one can obtain other physiologically important parameters. For instance, total hemoglobin concentration ([tHb]) and oxygenation (Ox) are defined as The near-infrared light is less likely to escape from blood vessels with diameters larger than 0.2 mm.14 Therefore the contribution to the optical signal is mainly from capillaries, venules, and arterioles, and the physiological parameters obtained using the NIRS method are close to those for the tissue, i.e., Ox approximately corresponds to tissue oxygenation (S t O 2).3.Measurement System and Procedure3.1.InstrumentationWe used a multichannel frequency-domain near-infrared spectrometer (Imagent, ISS, Champaign, Illinois), which is described in Ref. 11. Briefly, the instrument employs laser diodes (LD) modulated at the frequency of 110 MHz and photomultiplier tubes (PMT) whose gain is modulated at a slightly offset frequency of 110.005 MHz to heterodyne the high frequency down to the frequency of 5 kHz. In this study, 32 LDs (16 at 758 nm and 16 at 830 nm) and four PMTs were used. The LDs were multiplexed so that two LDs with the same wavelength and at the same location were on simultaneously. The light from the LDs was guided by optical fibers with a diameter of 400 μm to the tissue surface and the photons reemitted from the tissue were collected simultaneously by the bundles with a diameter of 5.6 mm, placed several centimeters apart from the source fibers. The collected light was carried to the PMTs and then the signals from the PMTs were digitally processed to yield the average intensity (I), modulation amplitude (M), and phase difference (ϕ). 3.2.Optical SensorIn order to recover the layered structure of the forehead, a large-range optode separation from 1 to 8 cm in 0.5 cm increments was employed. The arrangement of sources and detectors is shown in Fig. 1. Two laser diodes were turned on synchronously to double the intensity of light from remote sources. Neutral-density filters were installed at the end of these source fibers closer to the detector fibers to reduce excessive light and balance the overall detected light intensity. In order to provide a stable contact between fibers and the skin, right-angle prisms were attached to the ends of the fibers and a flexible black silicon pad was molded to hold fibers and prisms. 3.3.CalibrationEquations (3) and (4) are valid only if all the sources have equal intensity, modulation, and phase and if all the detectors have equal sensitivity. Different source intensities and phases and nonuniform optical coupling with the PMTs require an instrument calibration using a phantom with known optical properties. The calibration phantom was made of optically transparent silicone resin and its optical properties were set using black carbon and TiO 2 powders to mimic absorption and scattering of tissue, respectively. The optical properties of the phantom were made similar to those of the human forehead in order to provide an accurate calibration for the conditions in the tissue. To simulate the curvature of the human head, the phantom had a cylindrical shape with a radius of curvature of 10 cm. The sides of the phantom were covered with aluminum foil to simulate a semi-infinite medium by reflecting photons. We found that the curvature of the phantom is not a significant factor for errors when we calibrate on a phantom with a curvature similar to that of the head. 3.4.Human SubjectsFifteen female and 15 male healthy volunteers (from 20 to 50 years) were included in the study. A written informed consent was obtained from each subject. The subject, sitting in a dark room, was asked to relax during the 2-min baseline of measurement. The probe was positioned on three areas of the forehead (left, middle, and right), close to the hairline to avoid the channeling effect of the frontal sinuses. 3.5.Data AnalysisThe raw optical data for M and ϕ were converted into values of μa and μs ′ using Eqs. (3) and (4) after calculating the slopes of ln(ρ2M) and ϕ with respect to the source–detector distance ρ. To obtain values of μa and μs ′ corresponding to a specific ρ by using the multidistance method, we used data from five neighboring sources, which spanned a distance of 2 cm. Since the noise in ϕ increases exponentially as ρ increases, owing to the exponential decrease in the number of photons reaching the detector, we used the robustfit function in MATLAB 6.0. This function utilizes a weighted least-squares algorithm, with a lower weight for points that exhibit higher noise. In addition, ϕ was smoothed by a moving average. In order to characterize light penetration into the head, we evaluated the penetration depth z and the differential path length factor (DPF) for each ρ using the following expressions15: For nonlinear regression of the experimental parameters to the two-layer model, we used nlinfit in MATLAB 6.0. This function estimates the coefficients in the nonlinear function by using least-squares methods.In order to investigate the regional dependence of oxygenation and the lateralization of total hemoglobin concentration, respectively, we defined normalized quantities L Ox and L tHb as 4.Results4.1.Optical Properties of the Forehead as a Function of Source–Detector DistanceStudying the distance dependence of the optical properties, μa and μs ′ of the adult forehead, we found that the traces of μa and μs ′ as a function of ρ typically have a sigmoidal shape. Figure 2 shows global averages of μa and μs ′ over 30 subjects plotted with respect to the penetration depth z at wavelengths of 758 and 830 nm. Because of declining intensity readings at long distances in some subjects, we could not obtain enough signal-to-noise ratio at all the distances in some subjects. Each sigmoidal curve in Fig. 2 asymptotically approaches its lower and upper limits corresponding to μa and μs ′ values of scalp/skull and brain. The ensemble averages were performed only on the points with a sufficient signal to noise ratio. At intermediate depths (approximately z=0.8 to 1 cm), the information from both layers is mixed. In order to specify the penetration depth at which the curve approximately approaches the limit corresponding to the brain value, we defined the second turning point of z as a critical penetration depth zc. For both wavelengths, zc for μa and μs ′ is approximately 0.9 cm, which is about the thickness of the top layer. Figure 2Cross-subject averages (circles) and standard deviations (dotted lines) of the optical properties μa (a) and (c) and μs ′ (b) and (d), measured on the right side of the adult forehead, plotted with respect to z at two different wavelengths, λ1=758 nm and λ2=830 nm, respectively. The solid lines indicate the fitted curves of the average of μa and μs ′ obtained by a Gauss-Newton nonlinear least-squares fit.  4.2.Comparison with the Two-Layer ModelIt is important to determine whether the saturation values of μa and μs ′ at long ρ correspond to the optical properties of the brain. In order to examine this issue, we compared the solutions of the two-layer diffusion model derived by Kienle et al.; [Eqs. (17) and (18) in Ref. 12] with the experimental results from the adult head. Measurements of I, M, and ϕ were taken from the forehead of a male aged 38 whose scalp/skull thickness was measured using magnetic resonance imaging (MRI), and the values of μa and μs ′ at both the scalp/skull and brain were determined using Eqs. (3) and (4). Since the optical properties of the scalp/skull are similar to each other in the near-infrared region, we consider the scalp/skull as one layer. We compared I, M, and ϕ evaluated from the two-layer model with those values obtained from the adult head. The input parameters for R (ρ,ω) consisted of the measured μa 1 and μs ′1 of the first layer, and μa 2 and μs ′2 of the second layer, and the thickness of the first layer. From the asymptotic values at short distances from 1 to 3 cm, μa 1 and μs ′1 were determined to be 0.095±0.005 cm−1 and 12±0.2 cm−1, respectively. And at long distances from 5 to 7 cm, μa 2 and μs ′2 were 0.14±0.005 cm−1 and 4±0.2 cm−1, respectively. l was determined to be 1.1 cm from the MRI scan of the subject. Figure 3 compares the spatial distribution of M and ϕ obtained from the measurements and those obtained by two-layer model. There is good agreement between the experimental data and the prediction of the two-layer model. This suggests that μa 2 and μs ′2 extracted from the sigmoid curves represent the optical values of the bottom layer in the two-layer model. Figure 3A comparison of the frequency-domain parameters between experimental results and theoretical predictions based on the two-layered model. (a) The modulation amplitude, M and (b) the phase shift, ϕ were obtained from the right side of the forehead of a 38-year-old male with respect to ρ. The circles represent the measured values of M and ϕ, and the lines are the values predicted using the diffusion equation for the two-layer model. The optical coefficients of the top and bottom layers for the two-layered model were determined using the diffusion equation for the semi-infinite medium at short and long distances, respectively: μa=0.095 cm −1, μs ′=12 cm −1 for the top layer and μa=0.14 cm −1, μs ′=4 cm −1 for the bottom layer. The thickness of the top layer measured by MRI was 11 mm. The good agreement between the measured and the calculated data shows the internal consistency of our results. 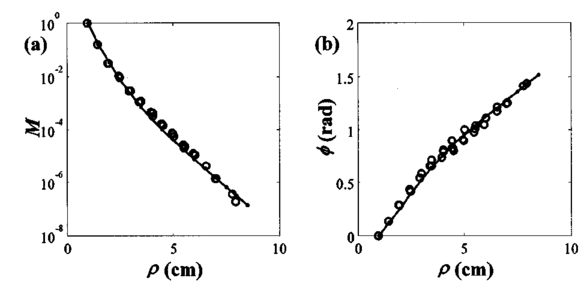 Our goal was to determine the optical properties of the brain from the reflectance data using a nonlinear regression of M and ϕ to the solution of the two-layer model. Kienel et al.;12 retrieved the optical properties of both layers within a tolerable error using nonlinear regression to a known l. However, when the l was unknown, the optical coefficients were not accurately retrieved, implying that the minimizing functions in the nonlinear regression have nonsingular local minima with respect to the five unknown parameters (μa 1, μs ′1, μa 2, μs ′2, and l).12 Measurements of the modulation and phase can be used to derive μa 2 and μs ′2 for given μa 1, μs ′1, and l values. Figure 4 shows graphically the relationship between μa 2 and μs ′2 and the experimental parameters of ∂ρ ln[ρ2M(ρ)] and ∂ρϕ for different top layer thicknesses of l when the optical properties for the first layer are given. To illustrate the influence of l, two examples are superimposed: l=10 and 15 mm. We see clearly in Fig. 4 that μa 2 and μs ′2 cannot be determined uniquely from the slopes of ln[ρ2M(ρ)] and ϕ if l is unknown. Therefore, the following procedure was used for brain measurements: (1) Determine μa 1 and μs ′1 from ln[ρ2M(ρ)] and ϕ(ρ) for small values of ρ (i.e., ρ=1 to 3 cm). (2) Obtain the anatomical information of l from an MRI scan. (3) Apply a nonlinear regression algorithm to iterate until one finds the parameters that best fit ln[ρ2M(ρ)] and ϕ(ρ) to the solution of the two-layer model. We used the asymptotic values of μa and μs ′ at long distances as initial values of μa 2 and μs ′2 for the iteration algorithm to obtain μa 2 and μs ′2 more effectively and precisely. Table 1 shows μa 2 and μs ′2 retrieved from the nonlinear regression and from the multidistance method for the same subject in Fig. 3. The good agreement confirms the absolute measurement of the brain. Figure 4The slopes of M and ϕ noted as ∂ρ log(ρ2M) and ∂ρϕ, which are fdNIRS parameters, are shown for different optical properties of the brain, μa 2 and μs ′2 at two different top layer thicknesses of l. The optical properties of the skin/skull are given as μa 1=0.1 cm −1 and μs ′1=10.0 cm −1. For given fdNIRS parameters, the optical properties of the brain cannot be uniquely determined when the other parameters are unknown. The slightly vertically tilted lines are isoscattering coefficient lines, and the slightly horizontally tilted lines are isoabsorption coefficient lines.  Table 1
4.3.Statistics of Physiological Parameters Across the Population of SubjectsA quantitative analysis of physiological parameters such as hemoglobin concentrations ([O 2 Hb], [HHb], and [tHb]) in the scalp/skull and brain, extracranial tissue oxygen saturation (S t O 2), and intracranial (cerebral) tissue oxygen saturation (cS t O 2) was performed in 30 healthy volunteers. The parameters were obtained using Eqs. (6), (7), and (8). Table 2 summarizes the results and Fig. 5 displays the respective histograms. For the extracranial and intracranial layers, we used a range of source–detector distances of 1 to 3.5 cm and 4.5 to 7 cm, respectively. In the distributions of the S t O 2, [O 2 Hb], [HHb], [tHb], and DPF in both extracranial and intracranial layers shown in Fig. 5, there is a larger variation in all parameters for the deeper layer. In addition, for the same depth, the histograms of the population of hemoglobin parameters ([O 2 Hb], [HHb], and [tHb]) show a broader distribution than that of S t O 2. This large intersubject variation in the hemoglobin concentrations may be due to anatomical variations among the subjects. However, it is interesting that for S t O 2, the between-subject variability is 3 for the extracranial layer and 6 for the brain. Figure 5Histograms of calculated S t O 2, [O 2 Hb], [HHb], [tHb], and DPF corresponding to a population of 30 adult foreheads. The average ρ for the extracranial and intracranial layers are 2.7 and 5.7 cm, respectively. The vertical axis in each histogram is the number of counts in each bin. Each subject was measured three times on the right, middle, and left sides.  Table 2
In Fig. 6, the standard errors in the oxygen saturation and the total hemoglobin concentration are plotted with respect to the standard error of the number of photons reemitted from the tissue during data acquisition of the baseline that we obtained from the left side of a randomly chosen subject. The standard error of the photon count is inversely proportional to the square root of the intensity I according to the Poisson distribution of noise and increases exponentially as ρ increases because of the exponential decrease of the number of photons reaching the detector at ρ. In Fig. 6, the variations in S t O 2 and [tHb] follow the trends of photon noise. Therefore the larger variation in the deeper layers is consistent with errors that are due to the noise on the reflectance intensity at a larger ρ. Figure 6Noise level of the photon counts versus (a) standard error σM of S t O 2 in percent and (b) σM of [tHb] in micromoles as a function of ρ.  Figure 7 shows the histogram of L Ox and L tHb These values contain the information on the normalized regional differences in the oxygen saturation and the tissue blood volume, respectively. Owing to individual differences in anatomy, L tHb is more broadly distributed than L Ox . The L Ox values concentrated to zero indicate that the oxygen saturation is symmetric in both hemispheres. Figure 7Histograms of calculated L Ox in (a) the scalp/skull and (b) the brain, and L tHb in (c) the scalp/skull and (d) the brain, corresponding to population of adult subjects. The average ρ’s for the extracranial and intracranial layers were 2.7 and 5.7 cm, respectively. The vertical axis is the number of subjects in each bin.  5.DiscussionThe sigmoidal dependencies of μa and μs ′ on z at the adult forehead measured with long-ranged, multidistance fdNIRS agree with the predictions of the two-layer model of the head. In addition, the nonlinear regression study with the solution of the two-layer model confirms that μa and μs ′ obtained by the multidistance fdNIRS method at longer than critical distances represent the absolute values of the brain. The decrease in μs ′ for deeper regions is consistent with μs ′ values for the skull and frontal lobe cortex determined by Bevilacqua et al.;16 by an in vivo fdNIRS method with source–detector distances of 1.0 to 1.4 cm. From μa plotted with respect to penetration depth, we see that the brain is more absorbing than the scalp/skull by a factor of about 1.3. This result is comparable to the result from the cited literature16 in which the ratio of μa in the skull to that in the frontal lobe cortex is about 1.2 at wavelengths of 674 and 849 nm. The nonlinear regression using the two-layer model routinely provided accurate estimates of the optical properties of the brain when the thickness and the optical properties of the scalp/skull were known. While this nonlinear regression algorithm is robust, it requires a massive amount of numerical calculations compared with the multidistance method and therefore will not be appropriate when real-time fast monitoring is required. In addition, the requirement for knowing the thickness of the scalp/skull hampers the use of this algorithm for recovering the optical properties of the brain. The consistency between the layer selectivity of the semi-infinite multidistance method and the nonlinear regression method confirms the layer selectivity of the semi-infinite multidistance method. It also advances the multidistance method as an easier way to determine the optical properties of the layered tissue. However, there is no way of making sure for each individual that the multidistance method eliminates the contamination from the top layer or that we can determine the minimum source–detector distance to safely reach the regions of interest at a certain depth. In Table 2, the differential path length factor measured from the adult head under the assumption of a semi-infinite medium has mean values of 6.04±0.63 and 4.99±1.7 for the scalp/skull and the brain, respectively. The DPF values for longer distances are less accurate than those for shorter distances, mainly because of the increased noise. In addition, the high intersubject variability in DPF and μs ′ shows that the values are dependent on the subject’s optical properties as well as the source–detector distance. Therefore, any NIRS quantification of hemodynamics and oxygen saturation that assumes a constant DPF and μs ′, which is commonly used for continuous-wave NIRS, will allow only a limited comparison of hemodynamic changes among subjects. For medical applications, the normal ranges of the hemoglobin content and oxygen saturation in the brain need to be studied in a much larger population to determine the normal and abnormal ranges of the values. To date, most studies of adult brains utilizing NIRS have assumed a constant DPF and μs ′ for a single optode measurement, in which the influence of the extracranial compartment on the brain is inevitable. Although the hemoglobin concentrations exhibit a regional dependence on the depth in our study, the oxygen saturation is less variable. Our results show slightly higher oxygen saturation values in the brain than in the scalp/skull (by about 3) in most of the subjects, but the difference is marginal compared with the difference in hemoglobin content in the brain and the scalp/skull. The cross-subject average value of the cerebral oxygenation in our measurements is 74.5, which is higher than the results of Levy et al.;17 in which the hemoglobin oxygen saturation averaged 56.5. In their study, 10 patients undergoing implantation and testing of internal cardioverting defibrillators were measured. Part of this difference in the oxygen saturation values may arise from hyperventilation during the operation, which would be expected to decrease cerebral blood flow and increase oxygen extraction. A newly introduced parameter, the lateralization of the cerebral oxygen saturation in our study, does not show any significant differences between right and left hemispheres. This symmetry in the oxygen saturation level agrees with the adult forehead study by Quaresima et al.;2 6.ConclusionsWe have demonstrated that: (1) The semi-infinite medium, multidistance frequency-domain method described in Ref. 11 can be used to noninvasively and accurately estimate the absolute absorption and reduced scattering coefficient of the adult brain. (2) The adult head can be reasonably described by a two-layer model and the nonlinear regression for this model can be used to retrieve the absolute absorption and reduced scattering coefficients of both layers if the thickness of the scalp/skull is known. (3) Using the two-layer model, the hemoglobin concentrations and oxygen saturation of the adult brain can be calculated with good accuracy. (4) The range of cerebral oxygen saturation among individuals is determined to be a low population standard deviation of 6. (5) The multidistance approach may provide a fast and efficient method for monitoring cerebral oxygen saturation and hemodynamics to assess cerebral health related to tissue oxygen perfusion. AcknowledgmentsThis work was supported by National Institutes of Health grant HD41342/07. The authors would also like to thank Alwin Kienle at Institut for Lasertechnologien in der Medizia und Messtechnik, Ulm, in Germany for his help with the two-layer model. REFERENCES
A. N. Yaroslavsky
,
P. C. Schulze
,
I. V. Yaroslavsky
,
R. Schober
,
F. Ulrich
, and
H.-J. Schwarzmaier
,
“Optical properties of selected native and coagulated human brain tissues in vitro in the visible and near infrared spectral range,”
Phys. Med. Biol. , 47 2059
–2073
(2002). Google Scholar
V. Quaresima
,
S. Sacco
,
R. Totaro
, and
M. Ferrari
,
“Noninvasive measurement of cerebral hemoglobin oxygen saturation using two near infrared spectrometer approaches,”
J. Biomed. Opt. , 5 201
–205
(2000). Google Scholar
C. D. Kurth
and
W. S. Thayer
,
“A multiwavelength frequency-domain near-infrared cerebral oximeter,”
Phys. Med. Biol. , 44 727
–740
(1999). Google Scholar
M. A. Franceschini
,
S. Fantini
,
L. A. Paunescu
,
J. S. Maier
, and
E. Gratton
,
“Influence of a superficial layer in the quantitative spectroscopic study of strongly scattering media,”
Appl. Opt. , 37 7447
–7457
(1998). Google Scholar
W. F. Cheong
,
S. A. Prahl
, and
A. J. Welch
,
“A review of the optical properties of biological tissues,”
IEEE J. Quantum Electron. , 26 2166
–2185
(1990). Google Scholar
P. van der Zee
,
M. Essenpreis
, and
D. T. Delpy
,
“Optical properties of brain tissue,”
Proc. SPIE , 18888 454
–465
(1993). Google Scholar
M. Firbank
,
M. Hiraoka
,
M. Essenpreis
, and
D. T. Delpy
,
“Measurement of the optical properties of the skull in the wavelength range 650–950 nm,”
Phys. Med. Biol. , 38 503
–510
(1993). Google Scholar
H. Dehghani
and
D. T. Delpy
,
“Near-infrared spectrometer of the adult head: effect of scattering and absorbing obstructions in the cerebrospinal fluid layer on light distribution in the tissue,”
Appl. Opt. , 39 4721
–4729
(2000). Google Scholar
J. Ripoll
,
M. Nieto-Vesperinas
, and
S. A. Arridge
,
“Effect of roughness in nondiffusive regions within diffusive media,”
J. Opt. Soc. Am. A , 18 940
–947
(2001). Google Scholar
J. B. Fishkin
,
S. Fantini
,
M. J. vandeVen
, and
E. Gratton
,
“Gigahertz photon density waves in a turbid medium: theory and experiments,”
Phys. Rev. E , 53
(3), 2307
–2319
(1996). Google Scholar
S. Fantini
,
M. A. Franceschini-Fantini
,
S. A. Walker
,
B. Barbieri
, and
E. Gratton
,
“Frequency-domain multichannel optical-detector for noninvasive tissue spectrometer and oximetry,”
Opt. Eng. , 34 32
–42
(1995). Google Scholar
A. Kienle
,
M. S. Patterson
,
N. Dognitz
,
R. Bays
,
G. Wagnieres
, and
H. van den Bergh
,
“Noninvasive determination of the optical properties of two-layer media,”
Appl. Opt. , 37 779
–791
(1998). Google Scholar
S. R. Arridge
,
“Photon-measurement density functions. Part I: analytic forms,”
Appl. Opt. , 34 7395
–7409
(1995). Google Scholar
M. Firbank
,
E. Okada
, and
D. T. Delpy
,
“Investigation of the effect of discrete absorbers upon the measurement of blood volume with near-infrared spectrometer,”
Phys. Med. Biol. , 42 465
–477
(1997). Google Scholar
M. S. Patterson
,
B. Chance
, and
B. C. Wilson
,
“Time-resolved reflectance and transmittance for the non-invasive measurement of optical properties,”
Appl. Opt. , 28 2331
–2336
(1989). Google Scholar
F. Bevilacqua
,
D. Piguet
,
P. Marquet
,
J. D. Gross
,
B. J. Tromberg
, and
C. Depeursinge
,
“In vivo local determination of tissue optical properties: application to human brain,”
Appl. Opt. , 38 4939
–4950
(1999). Google Scholar
W. J. Levy
,
S. Levin
, and
B. Chance
,
“Near-infrared measurement of cerebral oxygenation,”
Anesthesiology , 83
(4), 738
–746
(1995). Google Scholar
|
|||||||||||||||||||||||||||||||||||||||||||||||||||||||||||||||||||||||||||||||||||||||||||||||


CITATIONS
Cited by 178 scholarly publications and 4 patents.


