|
|
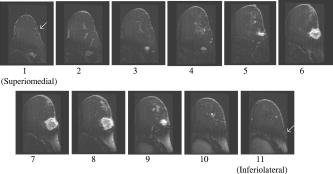
1.IntroductionNeoadjuvant chemotherapy (chemotherapy prior to surgery) is indicated for patients with locally advanced or inoperable breast cancers to reduce both primary tumor size and lymph node metastasis, as well as improve breast tissue conservation during surgery.1 Early monitoring of tumor response enables adjustments to chemotherapy dosage, agent, or delivery rate. Studies have shown that patients with complete clinical response have higher disease-free survival rates,2, 3 thus tailoring drug and dosage regimens to optimize tumor reaction may increase overall patient survival.4 Accurate imaging and disease characterization can play an important role in the management of neoadjuvant chemotherapy. Patient prognosis depends on both the initial extent of disease and the clinical response.5 Dynamic contrast-enhanced magnetic resonance imaging (MRI) methods have been used successfully by several groups to monitor neoadjuvant chemotherapy.6, 7, 8 MRI evaluation of tumor size correlates better to pathology than mammography and has success in determining stage and extent of disease,9 and locating residual disease.10, 11 Although MRI provides high-resolution anatomic images, the cost of the procedure can be prohibitive and contrast-enhanced MRI (cMRI) requires the use of exogenous contrast agents. In addition, functional information from cMRI is based on vasculature and enhancement parameters that are dependent on several complex factors.12 Broadband diffuse optical spectroscopy (DOS) can be employed to directly measure bulk tissue composition, providing a complementary approach to MRI that is relatively portable, inexpensive, and noninvasive. DOS combines multifrequency frequency-domain photon migration with continuous-wave near-IR (NIR) spectroscopy to quantitatively measure optical properties (absorption and scattering parameters) in thick tissues over a broad spectral region . NIR absorption and scattering spectra are then used to determine breast bulk tissue composition.13, 14 Monitoring hemoglobin oxygenation and concentration may play an important role as a predictor of tumor response to chemotherapy since tumor hypoxia and blood flow are correlated with chemotherapy resistance and degree of response.15, 16, 17 Optical methods have been employed to measure subtle physiological differences in healthy breast tissue,18, 19, 20, 21 to detect lesions in tissue with high optical contrast,22, 23, 24, 25, 26, 27 and to monitor response to neoadjuvant chemotherapy.28 Although DOS can provide detailed quantitative physiological information uniquely sensitive to tissue function the technique has inherently low spatial resolution. MRI provides high-resolution images of lesion structure that can be used to help interpret DOS results. In addition, since DOS measures concentrations of biological components directly and rapidly, optical methods can be used to characterize the physiological basis of MRI enhancement patterns and kinetics. For example, in preclinical animal model studies we have directly correlated DOS signatures with tumor regions classified as “viable,” “necrotic,” and “edematous” based on -weighted and -weighted contrast enhanced29 MRI. Recent work by Pogue 30 and Zhu 24 examine optical images in the context of MRI and ultrasound, showing that these radiological approaches can be used to help constrain the optical imaging inverse problem. Ultimately, diffuse optical methods require more detailed knowledge regarding the biological origins of intrinsic optical signals and their precise relationship to conventional methods. In a previous DOS case study of a neoadjuvant subject by Jakuboswki 28 we observed substantial changes in tumor physiology as a result of tumor response to chemotherapy. The case study presented here shows similar trends in hemoglobin, water, and lipid during treatment, indicating that DOS is detecting a true physiological tumor response. However, the tumor morphology, response, treatments, and measurement schedule were different in the two studies, so a direct comparison of results is not possible. Although these results were significant, little is known about the accuracy and sensitivity of intrinsic signal in vivo optical measurements. Few studies compare in vivo diffuse optics data to quantitative, in vivo clinical endpoints. Further complications arise from the fact that endogenous optical signals are not generally derived from the same structures that produce contrast using conventional methods. In this paper, we compare DOS measurements to cMRI in a dynamic system where tumor properties are altered by chemotherapy over a relatively brief time period. Reductions in tumor volume of 37.6% and peak enhancement of 39.7% were measured by cMRI, while similar size and hemoglobin concentration changes were observed in DOS line scans. These variations would naturally occur over a period of many years during the appearance and progression of disease, and would be difficult to follow in a single individual. Consequently, these studies are particularly important because they provide, for the first time, quantitative clinical endpoints that validate DOS sensitivity to physiological changes and establish the in vivo accuracy of optical methods that probe intrinsic tissue signals. 2.Materials and Methods2.1.SubjectThe subject was a -old postmenopausal female undergoing neoadjuvant chemotherapy for cancer of the right breast. The patient provided informed written consent under a protocol approved by the Committee on Human Research at the University of California at San Francisco (UCSF) (Approval # 87987-21608-01). The lesion was a palpable infiltrating ductal carcinoma located in the right upper outer quadrant of the breast with an initial size of , determined by MRI, prior to treatment. The subject was treated with a chemotherapy regimen of Adriamiycin and cyclophosphamide (AC) followed by taxane. Right breast lumpectomy was performed after the conclusion of the final Taxane cycle. The excised lesion was a moderately differentiated infiltrating ductal carcinoma. The combined MRI and DOS measurements were made at two time points during the subject’s chemotherapy regimen. The first time point was two weeks after the start of AC chemotherapy (prior to the second cycle), the lesion size was at this time point, as determined by MRI. The second measurement was after the start of chemotherapy prior to the start of Taxane, the lesion size was at this time point as determined by MRI. 2.2.MRI and AnalysisMagnetic Resonance (MR) images were acquired on a GE Signa scanner (GE Medical Systems, Milwaukee, Wisconsin) using a bilateral phased-array breast coil (MRI Devices Corporation, Wauksha, Wisconsin) [Fig. 1(a) ]. The patient was measured in the prone position with breasts placed inside the coil [Fig. 1(b)]. Unilateral, fat-suppressed -weighted cMRI of the breast was performed using a 3-D fast gradient recalled echo(3DFGRE) sequence using the following imaging parameters: repetition time , echo time , number of excitations , matrix, field of view , slice . Contrast agent gadolinium-diethylenetriaminepentaacetic acid (Gd-DTPA) was administered at a dose of using an indwelling catheter. Three high-resolution images were acquired in succession, one preceding and two following Gd-DTPA injection. Each image required for a complete scan. Central-phase encoding lines of each data set were acquired midway through the scan, yielding effective contrast sample times of 0, 2.5, and for the precontrast , early postcontrast , and late postcontrast images, respectively. In addition to cMRI, -weighted images were acquired using a 2-D fast spin echo sequence with the following parameters: , , , matrix, , slice with a gap between slices. Gd-DTPA-enhancement kinetics were analyzed by segmenting the lesion into regions that continued to enhanced between and (progressive enhancement) and areas that showed a signal decrease between and (washout). Image regions with are blacked out and not included in the analysis. Tumor volume was determined by manually delineating the tumor region of interest on each sagittal slice of the first postcontrast images . Total tumor volume was calculated by summing the region of interest volumes from each slice. 2.3.DOS InstrumentationThe laser breast scanner (LBS) [Fig. 2(a) ] is a bedside-capable system that combines frequency-domain photon migration (FDPM) with steady state (SS) tissue spectroscopy. The LBS determines the NIR absorption and scattering spectra of breast tissue in vivo. Detailed descriptions of the instrumentation and theory have been provided elsewhere.14 The FDPM component uses 6 fiber-coupled laser diodes (658, 682, 785, 810, 830, and ). These laser diodes are intensity-modulated at frequencies ranging from in 401 steps. Tissue optical properties at each diode wavelength are determined by simultaneously fitting the frequency-dependent phase and amplitude of the optical signals to a approximation to the transport equation for a semi-infinite geometry with an extrapolated boundary condition.14, 31 Instrument response functions are determined by measuring a phantom with known optical properties. Fig. 2(a) Photo of laser breast scanner and (b) photo and (c) diagram of the handheld probe containing an avalanche photodiode (APD), FDPM fiber bundle, and SS source and detector fibers. 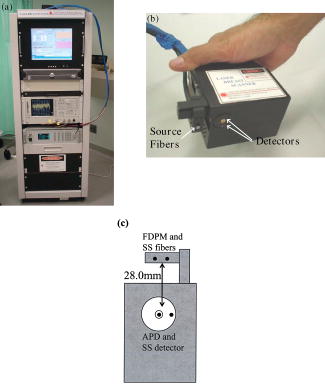 The SS component of the LBS consists of a high-intensity tungsten-halogen source and a spectrometer. Diffuse reflectance spectra are measured using a fiber coupled to a CCD-cooled imaging spectrometer (Oriel Inc.) between 650 and in increments. The FDPM and SS information are used together to produce complete NIR and spectra.13 Noninvasive tissue measurements are made using a handheld probe equipped with a FDPM laser fiber bundle, an APD, and SS source and detector fibers [Figs. 2(b) and 2(c)]. The source and detector separation was , from which we estimate an average penetration depth of in the tissue. The total measurement time to generate complete NIR absorption and scattering spectra from a single position is typically about . Data were analyzed with custom software developed in Matlab (version 6.0.0.88, The MathWorks, Inc). The absorption properties of the tissue are used to determine quantitative concentration measurements of oxygenated hemoglobin (Hb-O), deoxygenated hemoglobin (Hb-R), water, and lipid. The exact algorithm has been discussed in detail elsewhere.13, 14 Other NIR tissue absorbers such as myoglobin and cytochrome are assumed to have a negligible contribution to light absorption in breast tissue. From these parameters total hemoglobin concentration and tissue hemoglobin oxygenation saturation ) are calculated. The wavelength dependence of scattering follows the power law . The exponent scatter power has been related to the average size of the scattering particle32 and can provide insight into the structure and composition of the breast, such as the relative abundance of collagen, fat, and epithelial tissues.18 2.4.Combined Measurement TechniqueEleven positions were marked on the right breast (tumor side) using DOS (Fig. 3 ). Each position, spaced apart, was located on a line centered across the lesion, starting at the most superior-medial location. As a control, six positions were measured on the left breast (normal side) in the same location, but with intervals of , resulting in a scan that was the same length as on the lesion side . The positions of the DOS line scans were marked with a surgical pen. Fig. 3Eleven DOS measurements were taken at intervals across the lesion and surrounding normal tissue from superior to inferior in the right upper outer quadrant. Six DOS measurements were taken at intervals on the identical location on the left upper outer quadrant. 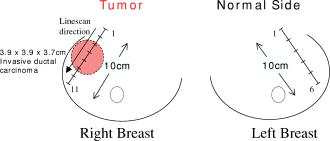 DOS measurements were correlated to MR image locations by using vitamin A tablets, which enhance on non-fat-suppressed MR and can be located by skin deformation on fat-suppressed images. The fiducials were placed on each of the premarked DOS positions and affixed to the skin surface with tape. Immediately after the MRI, the fiducials were removed and DOS measurements were performed on each of the marked locations. To assess measurement reproducibility, each line scan was repeated twice. DOS measurements were made with the subject in the supine position in contrast to MRI, which was performed with the subject in the prone position. 3.ResultsFat-suppressed -weighted sagittal cMRI of the right breast taken after the initial AC chemotherapy cycle revealed a invasive ductal carcinoma with a central area of necrosis and strong peripheral rim enhancement in the upper lateral right breast [Fig. 4(a) ]. The composition of the surrounding breast tissue is mostly fatty, as indicated by the dark regions. The -weighted sagittal image of the same breast shows increased intensity in the central area of the tumor mass, indicating high water content in the necrotic core [Fig. 4(b)]. The vitamin A fiducial is represented by a skin indentation above the lesion. The calculated tumor volume was . Figure 5 shows 11 reconstructed Gd-DTPA-enhanced axial images of the lesion. Fiducials can be seen as skin indentations on the images at positions 1 and 11. The images contain fiducial 1 on slice 106 and fiducial 11 on slice 206. Thus, every tenth slice approximates a DOS line scan position. The images show that the DOS linescan samples both tumor (positions 5 to 9) and surrounding normal tissues (positions 1 to 3 and 10 to 11). Since the tumor is located at the skin surface, DOS positions 6 to 8 sample primarily tumor tissue with little or no contribution of normal tissue to the signal. Fig. 5Reconstructed axial images of the lesion in Fig. 1. The 11 images correspond to the discrete DOS measurement sites. Fiducial at position 1 appeared on axial image 106 and fiducial at position 11 appeared on image 206. Thus, every tenth image was chosen to approximate a DOS measurement point. DOS-derived parameters of the right breast [Figs. 6(a) and 6(b) ] show that the tumor is located primarily between positions 5 and 9. There were significant differences between tissue at the lesion center (positions 6 and 7) compared to the periphery. There was a threefold to fourfold increase in water content ( versus , respectively), and a 2- to 2.5-fold increase in THC ( versus ). Concurrently, there were large reductions in lipid content (13 to 30% versus ) and ( versus ). The scatter power increased from 0.3 to 0.7 in normal tissue to at the center of the lesion and the scattering is at for all positions [Fig. 6(c)]. Figures 6(d) and 6(e) show DOS-derived parameters for the identical location on the left normal breast. Average lipid content is , average water content is , average THC is , and average oxygen saturation is , which are typical values for fatty postmenopausal breast.18 Values are relatively constant over the region measured. The scatter power is 0.30 to 0.56 and at is in the normal breast with a steady increase in value superior-medial to inferior-lateral. Physiological concentrations in the left breast are similar to those in the normal tissue of the right breast. MRI examination after the fourth cycle of AC revealed a lesion, a reduction in each dimension from the previous MRI, with a reduced tumor volume of (Fig. 7 ). Changes in enhancement kinetics were determined by segementing the lesion into regions with different enhancement kinetics. Figure 8 shows enhancement kinetic maps of a sagittal slice through the lesion obtained from cMRIs at both time points. Image regions where contrast enhancement at the late postcontrast time point is greater than the early postcontrast time point represent progressive enhancement and are colored blue (dark gray). Pixels where correspond to regions that enhance quickly and wash out, these regions are colored yellow (light gray). After one cycle of AC 51.3% of the tumor displayed contrast agent washout, after the fourth cycle, 26.1% of the tumor displayed contrast agent washout. Peak enhancement also decreased, after one cycle of AC, the mean percent enhancement (PE) value for the top 5% of enhancing voxels in the digitized MRI is 271.8% above background. After the fourth cycle of chemotherapy, the corresponding mean PE was 163.9%. These changes indicate that a reduction in contrast enhancement and signal washout has occurred in the lesion, in conjunction with a drop in tumor size. Fig. 8Enhancement kinetic maps for the lesion (a) after one chemo cycle and (b) after four chemo cycles. Blue (dark gray) represent progressive enhancement and yellow (light gray) pixels correspond to contrast agent washout.  Fig. 7Maximum intensity projections of the lesion (a) after one cycle of chemotherapy and (b) after four cycles of chemotherapy. The lesion measures in (a) versus in (b). 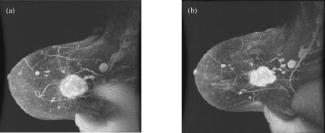 DOS results for both time points are shown in Figs. 9(a), 9(b), 9(c), 9(d) . The shapes of the linescans indicate that all measured parameters are sensitive to the decrease in tumor size. FWHM scans of water, THC, and lipid reveal a drop in tumor size [Figs. 9(a), 9(b), 9(c)], while values change over a region corresponding to [Fig. 9(d)]. There is a 43.7% overall reduction in total hemoglobin concentration (41.6 versus ) and the peak water concentration is similar at both time points (81 versus 75%). However, there is a 17.1% reduction in the overall water content of the lesion (44.4 versus 36.8%), a 7% decrease in , and the lipid content has increased by two- to three-fold in all positions across the tumor. Fig. 9Comparison of DOS-derived (a) water content, (b) total hemoglobin concentration, (c) lipid content, and (d) tissue oxygen saturation for the lesion after one cycle of chemotherapy and four cycles of chemotherapy. The full width half maximum (FWHM) is indicated on each linescan.  Table 1 compares changes in cMRI anatomic and kinetic parameters with DOS calculations. The 39.7% decrease in peak enhancement is indicative of vascular perfusion changes and agrees well with the 38.7% drop in total hemoglobin content determined by DOS. The 37.6% reduction in tumor volume is commensurate with optical measurements that show a 33% increase in lipid. Table 1Comparisons of changes in MR- and DOS-derived parameters demonstrating response to therapy.
4.DiscussionOne of the primary goals of this work is to evaluate whether DOS-derived physiological maps correspond to tumor structural features and perfusion dynamics determined by MRI and cMRI [Figs. 4, 5, 6]. In Fig. 4, the central area of necrosis is shown as a region of high intensity on -weighted MRI and low Gd-DTPA enhancement on cMRI, indicating high water content and low blood perfusion, respectively. DOS measurements of high tumor water content, low and low are in excellent agreement with these findings. These results match our previous observations from animal model studies for fluid-filled tumors with low cellularity.29 Fig. 4Fat-suppressed MR images of a -old postmenopausal woman with a invasive ductal carcinoma after one cycle of chemotherapy: (a) Gd-DTPA contrast-enhanced sagittal slice and (b) -weighted sagittal slice. Arrows point to vitamin A fiducials.  Fig. 6Corresponding DOS-derived results for the 11 measurement positions in Fig. 2(a) and 2(b) physiological and (c) scattering parameters were determined at intervals over the lesion and surrounding tissue. Normal tissue physiological (d) and scattering parameters (e) taken on the identical location on the contralateral breast at intervals. Error bars represent standard deviation of repeat measurements.  High Gd-DTPA enhancement associated with hypervascular tissue at the rim of the lesion is marked by high THC levels. Although there is no significant Gd-DTPA enhancement in the center of the tumor, DOS measures an increased concentration of hemoglobin in this region. This is due to the fact that Gd-DTPA enhancement is based solely on tissue perfusion, while DOS detects hemoglobin in the well-perfused tumor rim as well as the more static core. The reconstructed axial images representing DOS measurement positions reveal that DOS-derived parameters generally correspond to the anatomic extent of the tumor as established by MRI. For example, the tumor size determined by MRI agrees well with the FWHM of the DOS-derived lipid line scan. Note that the FWHM of the DOS-derived THC line scans shows elevated hemoglobin levels over (positions 4 to 9). This discrepancy suggests that the spatial extent of functional contrast in tissue is not confined to the precise tumor anatomic diameter. Thus, DOS measurements of lipid and hemoglobin appear to define tumor anatomic and functional dimension, respectively. MRI axial images with the greatest tumor cross section and closest proximity to the skin (positions 6 and 7) match DOS measurement positions with the highest contrast in physiological parameters. Note that lipid values at position 6 and 7 are lower than expected for breast tissue (13 to 30%). This can be explained by the fact that the tumor is superficial and, in these locations, DOS samples tissue with very little adipose. The dramatic tumor/normal contrast is due in part to superficial location of the lesion. Although deeper lesions will have a greater contribution of normal tissue to the signal (and less contrast); this is not well characterized. For these cases, depth information provided by radiographic or optical tomographic techniques can be used to better isolate tumor optical properties and contrast.33 In addition, our previous studies show that contrast in water and hemoglobin can be significant even for deeper lesions.22, 28, 34 Depth information provided by radiographic or optical tomographic techniques can be used to better isolate the tumor optical properties of deeper lesions. The effects of chemotherapy further support MRI/DOS anatomic and functional correlations. Reduction in tumor size determined by DOS linescan FWHM changes ( for water, lipid, and THC linescans) generally agree with changes in dimension established by MRI ( , Fig. 7). Studies comparing MRI size estimation to surgical methods have reported that histological regression due to chemotherapy can effect MRI prediction of tumor size.35 In addition, MRI underestimates tumors with mixed in situ and invasive components.36 Note also that DOS measurements were made at intervals, thus the coarseness of resolution of DOS may also play a role in determining lesion size. Changes in quantitative parameters derived from cMRI also correlate with DOS-derived physiological parameters. The decrease in tumor volume (37.6%) corresponds to an increase in tumor lipid over all positions (33%) between the two time points. The increase in lipid content reflects the greater contribution of normal (fatty) breast tissue to the weighted average of the DOS signal, which occurs with a decrease in tumor volume. Peak water content levels are similar at both time points (81 versus 75%), reflecting the absence of significant alterations in the fluid-filled necrotic center of the lesion. Further support that peak water signals primarily reflect a fluid-filled structure is provided by the concomitant decrease in scattering, shown in Figs. 6(a) and 6(b). The overall water content (determined from all positions) has decreased following chemotherapy, since the tumor has remained superficial through treatment the decrease in water is probably due to peripheral changes in tumor edema and cellularity. In deeper lesions, the tumor will shrink away from the skin surface and a greater contribution of normal tissue to the signal will indicate a reduction in size in addition to FWHM changes in the linescan. Note that the size of the lesion has not changed dramatically, but overall total hemoglobin has decreased considerably (41.6 versus ) which is validated by a decrease in peak enhancement and an overall reduction in signal washout in cMRI (Fig. 8 and Table 1). Contrast-enhancement intensity relative to background relates to the perfusion of Gd-DTPA within a region of tissue. Changes in peak PE are used to characterize tumor vascularity.11, 37 Furthermore, enhancement kinetics is related to vessel permeability, microvascular density, and histological grade of the lesion where enhancement washout is related to greater permeability and blood flow in the lesion and indicative of malignancy.38, 39 cMRI measurements clearly show a reduction in lesion perfusion and diminished vascular permeability following therapy. These observations confirm that significant functional response can occur in diseased tissue that cannot be assessed by changes in lesion size alone. The decrease in tumor cellularity and vasculature measured by DOS and cMRI is consistent with the cytotoxic and antiangiogenic action of AC therapy.40, 41, 42 Evaluation of in relation to other parameters is essential to understanding tumor growth and regression. Since hypoxic tumors have been found to be more resistant to chemotherapy, may be an important index for predicting tumor response.43 PET studies using radiolabeled water and glucose have shown that decreased blood flow is a predictor of response.15 Thus decreased THC in conjunction with decreased , as observed in this patient, may provide a strong indicator of tumor necrosis. Mankoff 15 also demonstrated that decreases in blood flow correlated with degree of response, indicating the importance of quantifying changes in vascular parameters. Since relative changes in calculated DOS parameters and quantitative cMRI kinetic enhancement values are comparable (Table 1) our data provide additional support for the idea that DOS and cMRI are sensitive to similar hemodynamic processes. These results suggest that DOS has potential as a stand-alone bedside monitoring device for chemotherapy. By combining DOS with MRI we are able to more accurately classify tissue types and enhance lesion diagnostic and prognostic capabilities in vivo. In addition, optical methods can be used to understand the origin of complex vascular factors involved in cMRI enhancement kinetics since tissue component concentrations are measured directly and not inferred.44 One source of error in our approach is related to the different position of the patient for the MRI scan (prone) versus the DOS measurement (supine). In future work, we hope to improve the coregistration of the two techniques by acquiring data under identical conditions. 5.ConclusionsThis study used high-resolution cMRI to validate DOS-measured physiological changes in a patient with invasive ductal carcinoma undergoing chemotherapy. The DOS-derived physiological data correlate with cMRI measurements of necrosis, vasculature, and lesion size. Quantitative changes in kinetic parameters derived from cMRI correlate with DOS-derived physiological parameters, primarily total hemoglobin, oxygen saturation, and water content. Our results also validate the sensitivity of DOS to physiological changes in tissue, confirming our previous work monitoring lesion response to neoadjuvant chemotherapy. AcknowledgmentsThis work was made possible by the National Institutes of Health (NIH) National Center for Research Resources (NCRR) center, the Laser Microbeam and Medical Program (LAMMP, P41RR01192), the California Breast Cancer Research Program, and the National Cancer Institute (NCI) Network for Translational Research in Optical Imaging (NTROI) program (U54CA105480). Beckman Laser Institute programmatic support is provided by the Air Force Office of Scientific Research (AFOSR) and the Beckman Foundation. Use of Chao Family Comprehensive Cancer Center facilities at the University of California at Irvine (UCI) and the UCSF Magnetic Resonance Science Center is gratefully acknowledged. The authors wish to thank Amanda Fedyk for her contributions in constructing and shipping the LBS instrument to UCSF, Lorna Beccaria the clinical coordinator for the study, Evelyn Proctor and Niles Bruce the MRI technicians. Finally, the authors wish to thank the patient who generously volunteered for the study. ReferencesK. K. Hunt,
F. C. Ames,
S. E. Singletary,
A. U. Buzdar, and
G. N. Hortobagyi,
“Locally advanced noninflammatory breast cancer,”
Surg. Clin. North Am., 76
(2), 393
–410
(1996). https://doi.org/10.1016/S0039-6109(05)70446-1 0039-6109 Google Scholar
H. M. Kuerer,
A. A. Sahin,
K. K. Hunt,
L. A. Newman,
T. M. Breslin,
F. C. Ames,
M. I. Ross,
A. U. Buzdar,
G. N. Hortobagyi, and
S. E. Singletary,
“Incidence and impact of documented eradication of breast cancer axillary lymph node metastases before surgery in patients treated with neoadjuvant chemotherapy,”
Ann. Surg., 230
(1), 72
–78
(1999). https://doi.org/10.1097/00000658-199907000-00011 0003-4932 Google Scholar
H. M. Kuerer,
L. A. Newman,
T. L. Smith,
F. C. Ames,
K. K. Hunt,
K. Dhingra,
R. L. Theriault,
G. Singh,
S. M. Binkley,
N. Sneige,
T. A. Buchholz,
M. I. Ross,
M. D. McNeese,
A. U. Buzdar,
G. N. Hortobagyi, and
S. E. Singletary,
“Clinical course of breast cancer patients with complete pathologic primary tumor and axillary lymph node response to doxorubicin-based neoadjuvant chemotherapy,”
J. Clin. Oncol., 17
(2), 460
–469
(1999). 0732-183X Google Scholar
T. A. Buchholz,
K. K. Hunt,
G. J. Whitman,
A. A. Sahin, and
G. N. Hortobagyi,
“Neoadjuvant chemotherapy for breast carcinoma: multidisciplinary considerations of benefits and risks,”
Cancer, 98
(6), 1150
–1160
(2003). 0008-543X Google Scholar
J. Y. Pierga,
E. Mouret,
V. Laurence,
V. Dieras,
A. Savigioni,
P. Beuzeboc,
T. Dorval,
T. Palangie,
M. Jouve, and
P. Pouillart,
“Prognostic factors for survival after neoadjuvant chemotherapy in operable breast cancer. the role of clinical response,”
Eur. J. Cancer, 39
(8), 1089
–1096
(2003). https://doi.org/10.1016/S0959-8049(03)00069-8 0959-8049 Google Scholar
C. Balu-Maestro,
C. Chapellier,
A. Bleuse,
I. Chanalet,
C. Chauvel, and
R. Largillier,
“Imaging in evaluation of response to neoadjuvant breast cancer treatment benefits of MRI,”
Beitr. Tabakforsch. Int., 72
(2), 145
–152
(2002). 0173-783X Google Scholar
P. J. Drew,
M. J. Kerin,
T. Mahapatra,
C. Malone,
J. R. Monson,
L. W. Turnbull, and
J. N. Fox,
“Evaluation of response to neoadjuvant chemoradiotherapy for locally advanced breast cancer with dynamic contrast-enhanced MRI of the breast,”
Eur. J. Surg. Oncol., 27
(7), 617
–620
(2001). 0748-7983 Google Scholar
R. Gilles,
J. M. Guinebretiere,
C. Toussaint,
M. Spielman,
M. Rietjens,
J. Y. Petit,
G. Contesso,
J. Masselot, and
D. Vane,
“Locally advanced breast cancer: contrast-enhanced subtraction MR imaging of response to preoperative chemotherapy,”
Radiology, 191
(3), 633
–638
(1994). 0033-8419 Google Scholar
L. Esserman,
N. Hylton,
L. Yassa,
J. Barclay,
S. Frankel, and
E. Sickles,
“Utility of magnetic resonance imaging in the management of breast cancer: evidence for improved preoperative staging,”
J. Clin. Oncol., 17
(1), 110
–119
(1999). 0732-183X Google Scholar
D. C. Abraham,
R. C. Jones,
S. E. Jones,
J. H. Cheek,
G. N. Peters,
S. M. Knox,
M. D. Grant,
D. W. Hampe,
D. A. Savino, and
S. E. Harms,
“Evaluation of neoadjuvant chemotherapeutic response of locally advanced breast cancer by magnetic resonance imaging,”
Cancer, 78
(1), 91
–100
(1996). 0008-543X Google Scholar
S. C. Partridge,
J. E. Gibbs,
Y. Lu,
L. J. Esserman,
D. Sudilovsky, and
N. M. Hylton,
“Accuracy of MR imaging for revealing residual breast cancer in patients who have undergone neoadjuvant chemotherapy,”
AJR, Am. J. Roentgenol., 179
(5), 1193
–1199
(2002). 0361-803X Google Scholar
A. R. Padhani,
“Contrast agent dynamics in breast MRI,”
Breast MRI in Practice, 43
–54 Martin Dunitz, London (2002). Google Scholar
F. Bevilacqua,
A. J. Berger,
A. E. Cerussi,
D. Jakubowski, and
B. J. Tromberg,
“Broadband absorption spectroscopy in turbid media by combined frequency-domain and steady-state methods,”
Appl. Opt., 39
(34), 6498
–6507
(2000). 0003-6935 Google Scholar
T. H. Pham,
O. Coquoz,
J. B. Fishkin,
E. Anderson, and
B. J. Tromberg,
“Broad bandwidth frequency domain instrument for quantitative tissue optical spectroscopy,”
Rev. Sci. Instrum., 71
(6), 2500
–2513
(2000). https://doi.org/10.1063/1.1150665 0034-6748 Google Scholar
D. A. Mankoff,
L. K. Dunnwald,
J. R. Gralow,
G. K. Ellis,
M. J. Drucker, and
R. B. Livingston,
“Monitoring the response of patients with locally advanced breast carcinoma to neoadjuvant chemotherapy using [technetium ]-sestamibi scintimammography,”
Cancer, 85
(11), 2410
–2423
(1999). 0008-543X Google Scholar
P. Vaupel and
M. Hockel,
“Blood supply, oxygenation status and metabolic micromilieu of breast cancers: characterization and therapeutic relevance,”
Int. J. Oncol., 17
(5), 869
–879
(2000). 1019-6439 Google Scholar
B. A. Teicher,
“Hypoxia and drug resistance,”
Cancer Metastasis Rev., 13
(2), 139
–168
(1994). 0891-9992 Google Scholar
A. E. Cerussi,
A. J. Berger,
F. Bevilacqua,
N. Shah,
D. Jakubowski,
J. Butler,
R. F. Holcombe, and
B. J. Tromberg,
“Sources of absorption and scattering contrast for near-infrared optical mammography,”
Acad. Radiol., 8
(3), 211
–218
(2001). 1076-6332 Google Scholar
R. Cubeddu,
C. D’Andrea,
A. Pifferi,
P. Taroni,
A. Torricelli, and
G. Valentini,
“Effects of the menstrual cycle on the red and near-infrared optical properties of the human breast,”
Photochem. Photobiol., 72
(3), 383
–391
(2000). https://doi.org/10.1562/0031-8655(2000)072<0383:EOTMCO>2.0.CO;2 0031-8655 Google Scholar
N. Shah,
A. Cerussi,
C. Eker,
J. Espinoza,
J. Butler,
J. Fishkin,
R. Hornung, and
B. Tromberg,
“Noninvasive functional optical spectroscopy of human breast tissue,”
Proc. Natl. Acad. Sci. U.S.A., 98
(8), 4420
–4425
(2001). https://doi.org/10.1073/pnas.071511098 0027-8424 Google Scholar
S. Srinivasan,
B. W. Pogue,
S. Jiang,
H. Dehghani,
C. Kogel,
S. Soho,
J. J. Gibson,
T. D. Tosteson,
S. P. Poplack, and
K. D. Paulsen,
“Interpreting hemoglobin and water concentration, oxygen saturation, and scattering measured in vivo by near-infrared breast tomography,”
Proc. Natl. Acad. Sci. U.S.A., 100
(21), 12349
–12354
(2003). https://doi.org/10.1073/pnas.2032822100 0027-8424 Google Scholar
B. J. Tromberg,
N. Shah,
R. Lanning,
A. Cerussi,
J. Espinoza,
T. Pham,
L. Svaasand, and
J. Butler,
“Non-invasive in vivo characterization of breast tumors using photon migration spectroscopy,”
Neoplasia, 2
(1–2), 26
–40
(2000). https://doi.org/10.1038/sj.neo.7900082 1522-8002 Google Scholar
B. W. Pogue,
S. P. Poplack,
T. O. McBride,
W. A. Wells,
K. S. Osterman,
U. L. Osterberg, and
K. D. Paulsen,
“Quantitative hemoglobin tomography with diffuse near-infrared spectroscopy: pilot results in the breast,”
Radiology, 218
(1), 261
–266
(2001). 0033-8419 Google Scholar
Q. Zhu,
M. Huang,
N. Chen,
K. Zarfos,
B. Jagjivan,
M. Kane,
P. Hedge, and
S. H. Kurtzman,
“Ultrasound-guided optical tomographic imaging of malignant and benign breast lesions: initial clinical results of 19 cases,”
Neoplasia, 5
(5), 379
–388
(2003). 1522-8002 Google Scholar
H. Dehghani,
B. W. Pogue,
S. P. Poplack, and
K. D. Paulsen,
“Multiwavelength three-dimensional near-infrared tomography of the breast: initial simulation, phantom, and clinical results,”
Appl. Opt., 42
(1), 135
–145
(2003). 0003-6935 Google Scholar
V. Ntziachristos,
A. G. Yodh,
M. D. Schnall, and
B. Chance,
“MRI-guided diffuse optical spectroscopy of malignant and benign breast lesions,”
Neoplasia, 4
(4), 347
–354
(2002). https://doi.org/10.1038/sj.neo.7900244 1522-8002 Google Scholar
T. O. McBride,
B. W. Pogue,
S. Poplack,
S. Soho,
W. A. Wells,
S. Jiang,
U. L. Osterberg, and
K. D. Paulsen,
“Multispectral near-infrared tomography: a case study in compensating for water and lipid content in hemoglobin imaging of the breast,”
J. Biomed. Opt., 7
(1), 72
–79
(2002). https://doi.org/10.1117/1.1428290 1083-3668 Google Scholar
D. B. Jakubowski,
A. E. Cerussi,
F. Bevilacqua,
N. Shah,
D. Hsiang,
J. Butler, and
B. J. Tromberg,
“Monitoring neoadjuvant chemotherapy in breast cancer using quantitative diffuse optical spectroscopy: a case study,”
J. Biomed. Opt., 9
(1), 230
–238
(2004). https://doi.org/10.1117/1.1629681 1083-3668 Google Scholar
S. Merritt,
F. Bevilacqua,
A. J. Durkin,
D. J. Cuccia,
R. Lanning,
B. J. Tromberg,
G. Gulsen,
H. Yu,
J. Wang, and
O. Nalcioglu,
“Coregistration of diffuse optical spectroscopy and magnetic resonance imaging in a rat tumor model,”
Appl. Opt., 42
(16), 2951
–2959
(2003). 0003-6935 Google Scholar
B. W. Pogue,
H. Zhu,
C. Nwaigwe,
T. O. McBride,
U. L. Osterberg,
K. D. Paulsen, and
J. F. Dunn,
“Hemoglobin imaging with hybrid magnetic resonance and near-infrared diffuse tomography,”
Adv. Exp. Med. Biol., 530 215
–224
(2003). 0065-2598 Google Scholar
R. C. Haskell,
L. O. Svaasand,
T. Tsong-Tseh,
F. Ti-Chen,
M. S. McAdams, and
B. J. Tromberg,
“Boundary conditions for the diffusion equation in radiative transfer,”
J. Opt. Soc. Am. A, 11
(10), 2727
–2741
(1994). 0740-3232 Google Scholar
A. M. K. Nilsson,
C. Sturesson,
D. L. Liu, and
S. Andersson-Engels,
“Changes in spectral shape of tissue optical properties in conjunction with laser-induced thermotherapy,”
Appl. Opt., 37
(7), 1256
–1267
(1998). 0003-6935 Google Scholar
N. G. Chen,
M. Huang,
H. Xia,
D. Piao,
E. Cronin, and
Q. Zhu,
“Portable near-infrared diffusive light imager for breast cancer detection,”
J. Biomed. Opt., 9
(3), 504
–510
(2004). https://doi.org/10.1117/1.1695410 1083-3668 Google Scholar
N. Shah,
A. E. Cerussi,
D. B. Jakubowski,
D. Hsiang,
J. Butler, and
B. J. Tromberg,
“The role of diffuse optical spectroscopy in the clinical management of breast cancer,”
Dis. Markers, 19
(2–3), 95
–105
(2004). 0278-0240 Google Scholar
K. Wasser,
H. P. Sinn,
C. Fink,
S. K. Klein,
H. Junkermann,
H. P. Ludemann,
I. Zuna, and
S. Delorme,
“Accuracy of tumor size measurement in breast cancer using MRI is influenced by histological regression induced by neoadjuvant chemotherapy,”
Eur. Radiol., 13
(6), 1213
–1223
(2003). 0938-7994 Google Scholar
M. Kristoffersen Wiberg,
P. Aspelin,
M. Sylvan, and
B. Bone,
“Comparison of lesion size estimated by dynamic MR imaging, mammography and histopathology in breast neoplasms,”
Eur. Radiol., 13
(6), 1207
–1212
(2003). 0938-7994 Google Scholar
P. S. Tofts,
“Modeling tracer kinetics in dynamic Gd-DTPA MR imaging,”
J. Magn. Reson Imaging, 7
(1), 91
–101
(1997). 1053-1807 Google Scholar
L. Esserman,
N. Hylton,
T. George, and
N. Weidner,
“Contrast-enhanced magnetic resonance imaging to assess tumor histopathology and angiogenesis in breast carcinoma,”
Breast J., 5
(1), 13
–21
(1999). https://doi.org/10.1046/j.1524-4741.1999.005001013.x 1075-122X Google Scholar
K. Kinkel and
N. M. Hylton,
“Challenges to interpretation of breast MRI,”
J. Magn. Reson Imaging, 13
(6), 821
–829
(2001). 1053-1807 Google Scholar
W. M. Martin and
N. J. McNally,
“The cytotoxic action of adriamycin and cyclophosphamide on tumor cells in vitro and in vivo,”
Int. J. Radiat. Oncol., Biol., Phys., 5
(8), 1309
–1312
(1979). 0360-3016 Google Scholar
B. Lennernas,
P. Albertsson,
H. Lennernas, and
K. Norrby,
“Chemotherapy and antiangiogenesis—drug-specific, dose-related effects,”
Acta Oncol. (Madr), 42
(4), 294
–303
(2003). 0001-6381 Google Scholar
T. Browder,
C. E. Butterfield,
B. M. Kraling,
B. Shi,
B. Marshall,
M. S. O’Reilly, and
J. Folkman,
“Antiangiogenic scheduling of chemotherapy improves efficacy against experimental drug-resistant cancer,”
Cancer Res., 60
(7), 1878
–1886
(2000). 0008-5472 Google Scholar
A. M. Shannon,
D. J. Bouchier-Hayes,
C. M. Condron, and
D. Toomey,
“Tumour hypoxia, chemotherapeutic resistance and hypoxia-related therapies,”
Cancer Treat Rev., 29
(4), 297
–307
(2003). 0305-7372 Google Scholar
D. J. Cuccia,
F. Bevilacqua,
A. J. Durkin,
S. Merritt,
B. J. Tromberg,
G. Gulsen,
H. Yu,
J. Wang, and
O. Nalcioglu,
“In vivo quantification of optical contrast agent dynamics in rat tumors by use of diffuse optical spectroscopy with magnetic resonance imaging coregistration,”
Appl. Opt., 42
(16), 2940
–2950
(2003). 0003-6935 Google Scholar
|