|
|
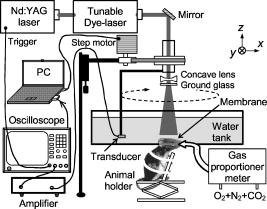
1.IntroductionBecause the brain is highly responsive to changes in blood oxygenation and blood flow, high-speed and high-resolution mapping of the concentration of total hemoglobin (HbT) and of hemoglobin oxygen saturation is of great significance in neurophysiology, neuropathology, and neurotherapy. For example, visualizing the functional parameters of brain cancers and traumatic brain injuries, monitoring ischemia and shock, and studying neuronal activities are all of interest. Despite decades of work, however, until now no technique has been developed that is clinically feasible for high-resolution, accurate, continuous, and noninvasive imaging of HbT and in organs such as the brain. Brain physiology and pathology are associated with various optical properties, including absorption, scattering and fluorescence, of the brain tissues, which is well known and widely employed in medicine. Based on the high optical contrast, diffuse optical technologies, such as near-IR spectroscopy (NIRS), can measure the dynamic and functional properties of neurosystems, such as cerebral blood volume and cerebral blood oxygenation.1, 2, 3 Nevertheless, because of the overwhelming scattering of optical waves in biological tissues, noninvasive diffuse optical technologies have limited spatial resolution. Photoacoustic tomography (PAT), also referred to as optoacoustic tomography or thermoacoustic tomography, 4, 5, 6, 7, 8, 9, 10, 11, 12, 13, 14, 15, 16 is a hybrid noninvasive imaging modality that combines high optical contrast and high ultrasonic resolution. In other words, PAT overcomes both the disadvantage of optical imaging in spatial resolution and the disadvantage of ultrasonography in biochemical contrast and speckle artifact. Hoelen 8 applied the photoacoustic technique to image blood vessels deep in highly scattering samples and achieved satisfactory axial resolution. Photoacoustic detection of deeply embedded absorbing objects colored with bovine hemoglobin was achieved by Esenaliev 9 More recently, Kolkman 12 explored the photoacoustic imaging of blood vessels in human skin. Fainchtein 17 studied photoacoustic measurements on in vitro and in vivo blood samples and proved that this technique can assess relative changes in concentrations of both oxygenated hemoglobin and deoxygenated hemoglobin (Hb). Single-wavelength photoacoustic detection was used by Esenaliev 18 to monitor relative changes in blood oxygenation in vitro. In our own previous work, we achieved noninvasive photoacoustic imaging of small-animal brains based on the intrinsic optical absorption of the brain tissues.14, 15 Here, for the first time to our knowledge, we apply PAT operated at multiple optical wavelengths to the study of two functional parameters, cerebral blood volume and blood oxygenation, in small-animal brains in vivo. Because it has been proven that our PAT system is able to image tissue structures deep in intact brains with laser light in the visible region,15 noninvasive functional imaging of small-animal brain as a whole organ is promising. Functional PAT of blood and HbT relies on the spectroscopic differences between and Hb. Because and Hb are the dominant absorbing compounds in a biological sample in the spectral region under study, photoacoustic measurements of the sample at two wavelengths are sufficient to quantify these two chromophores as a first-order approximation. In contrast to NIRS, which measures diffuse light, PAT detects the weakly scattered photoacoustic signals (ultrasonic waves) that are produced directly by optical absorption. As a result, PAT can image complex biological structures, such as the cortical vasculature, with satisfactory spatial resolution that is primarily limited by the bandwidth of the detected photoacoustic signals. The ability to image hemoglobin concentration and oxygenation simultaneously with high spatial resolution will enable detailed quantitative mapping and analysis of the spatiotemporal hemodynamics of functional brain activities, including oxygen metabolism. 2.Materials and Methods2.1.Functional PAT SystemsThe PAT system for the functional imaging of hemoglobin concentration and oxygenation in the rat brain cerebral cortex is shown in Fig. 1 . A tunable dye laser (ND6000, Continuum) pumped by an laser (Brilliant B, Bigsky) provided irradiation pulses. The laser pulse duration was at the full width at half maximum (FWHM). The pulse repetition rate was . The laser beam was expanded and homogenized by a concave lens and, subsequently, by a piece of ground glass before it reached the rat head. The incident energy density of the laser beam on the surface of the rat head was controlled to (within the ANSI standard19), which, attenuated and homogenized further by the skin and skull, induced a temperature rise in the brain vessels estimated to be . An unfocused ultrasonic transducer (XMS-310, Panametrics) was driven by a computer-controlled step motor to scan circularly around the rat brain cortex in the horizontal plane with a scanning radius of and a scanning step size of . The transducer had a central frequency of , a bandwidth of at , and an active element diameter . The photoacoustic signals received by the transducer were sent to an oscilloscope (TDS 540B, Tektronics) through an amplifier. Finally, the computer collected the digitized photoacoustic signals for image reconstruction. 2.2.Image ReconstructionBrain tissues have inhomogeneous optical absorption but relatively homogeneous acoustic properties. When the laser pulse is sufficiently short, as in our experiments, the time required for thermal diffusion over the length scale of the resolution is much greater than the pulse width of the laser. Consequently, the effect of heat conduction in the thermoacoustic wave equations can be ignored. In this case, the photoacoustic signal at position and time is related to the heating source by the following wave equation20: where is the acoustic velocity; is the isobaric volume expansion coefficient; is the specific heat; is the heating function defined as the optical energy deposited by the irradiation source per unit time per unit volume (in watts per cubic meter), which can be written as the product of a spatial absorption function and a temporal illumination functionwhere describes the temporal profile of the light with units of 1/s, which can be regarded as a Dirac delta function for a short laser pulse; and describes the optical energy deposition at with units of joules per cubic meter. The photoacoustic signal can be rewritten asIf the incident optical energy density and the structure of the absorbing object remain unchanged, the intensity of the photoacoustic signals produced by this object is proportional to its optical absorption.Let us consider the 2-D imaging of a sample through a circular scan of photoacoustic signals around the imaging plane. When the scanning radius is much greater than the wavelengths of the photoacoustic signals contributing to the imaging (which is true in our experiments), the distribution of optical absorption in the imaging plane can be reconstructed by the following modified back-projection algorithm: which is an integral over the angle along the scanning circle.21 If the laser energy is homogeneous in the imaging plane, the photoacoustic image of describes the distribution of the optical absorption in the biological tissues at a specific wavelength.Employing a full-view circular-scan geometry, the optical absorption in the biological sample can be accurately reconstructed from the detected photoacoustic signals with Eq. 4. Through analysis of the photoacoustic signals from the animal brains that were detected by the ultrasonic transducer, the cutoff frequency was up to . The FWHM of the point spread function for this imaging system is estimated22 to be , where the acoustic velocity in the biological tissues is . Accordingly, the highest lateral resolution, the resolution in the imaged cross section, that is achievable at the center of the scanning circle is , which matches our experimental result on phantom samples.23 Due to the aperture of the transducer, this lateral resolution will degrade for areas away from the scanning center. As a result, in the outer areas of the brain cortex that are about from the center, the estimated lateral resolution is 0.5 to . In this study, the unfocused transducer scanned around the imaged cross section in the horizontal plane to realize 2-D imaging of the brain cerebral cortex. In this case, the axial resolution, the resolution along the axis, is limited. However, with the applied irradiation and detection geometry, the dominant photoacoustic signals received by the transducer come from the vasculature in the cortex at the dorsal part of the rat brain that is flat and lying in the imaged cross section. Using the modified back-projection algorithm, the signals from absorbing objects out of the scanning plane are strongly blurred, which causes only some changes in the background. Because the photoacoustic signals from the large blood vessels at the ventral part of the brain are comparatively smaller than those from the dorsal brain, the obscuration generated in the imaged cross section is minor. Moreover, because the detection plane is parallel with the incident plane of the laser pulses, the photoacoustic signals from this plane have a minimal dynamic range compared with those in any other planes. This also improves the accuracy of the data acquisition and reconstruction as well as the measurement of functional hemodynamic changes. In our current PAT system, the oscilloscope used to digitize photoacoustic signals works on 8 bits. When the incident light energy is stable (which can be monitored and recorded for calibration), the smallest changes in hemoglobin concentration and oxygenation that can be detected is on the order of 0.4%. 2.3.Spectroscopic PAT of HbT andIn optical measurements of hemoglobin concentration and oxygenation, we assume that Hb and are the dominant absorbing compounds at two wavelengths and . HbT and can then be calculated using the detected optical absorptions at the two applied wavelengths 24, 25, 26, 27: where (in inverse ) is the absorption coefficient; and are the known molar extinction coefficients of Hb and , respectively; ; and [Hb] and are the concentrations (in molar concentration) of the two forms of hemoglobin, respectively.By irradiating a rat head with light at two different wavelengths, and , independently, one can get two photoacoustic images that present the distributions of the optical energy deposition, and , in the cerebral cortex corresponding to the two wavelengths. The optical energy deposition is dependent on the optical absorption and the light fluence at . Considering that the skin and skull covering the brain are homogeneous, the light fluence in the brain cerebral cortex is homogeneously distributed in the horizontal plane. In an in vitro experiment, we measured the intensities of light penetrated through the skin and skull of the rats that were from the same group as those employed in the in vivo brain imaging experiment. The fractions of light energy that can reach the brain cerebral cortex were and at the 584- and 600-nm wavelengths, respectively, primarily due to the strong scattering of light in the skin and skull. These fractions of light transmission can be used to calibrate the relative intensity between the photoacoustic images corresponding to the two optical wavelengths. Therefore, the two photoacoustic images of and , after they are normalized by considering the incident light energy densities and the attenuations of light energy by the skin and skull, present the distributions of the relative optical absorption, and , in the cerebral cortex corresponding to the two wavelengths. With Eqs. 5, 6, we can then calculate the images of an absolute estimation of and a relative estimation of HbT in the rat brain cerebral cortex as a first-order approximation. The spectral region employed in this work was between 580 and . In this region, the absorption contrast between blood and background brain tissues was high enough to enable satisfactory imaging quality. For example, the optical absorption contrast between the whole blood and the gray matters in the brain is larger than 100:1 at 580-nm wavelength.28 Meanwhile, the penetration depth of light in this region, even in blood, was similar to, or greater than, the diameter of the imaged brain vessel branches . Moreover, Hb and were the only chromophores of significance, and scattering was assumed to be relatively constant over this region.29 The relative extinction coefficients of Hb and in the applied spectral region were detected through photoacoustic measurements of in vitro rat blood samples with known levels. These coefficients were then used in the calculations of the HbT and in the in vivo experiments. 2.4.Test on Phantom SamplesThe sensitivity of this multiwavelength PAT system to HbT and was first tested with phantom samples of mixed dye solutions. Two kinds of dyes made from Fiesta Red and Lake Placid Blue inks (PenCity, Georgia) were employed to mimic and Hb, respectively. The absorption coefficients of the red dye at 580- and 600-nm wavelengths were 23.9 and ; respectively; while the absorption coefficients of the blue dye at the two wavelengths were 14.1 and , respectively. These absorption coefficients were of the same order as the typical optical absorption of whole blood at the applied wavelengths. These two dyes were first mixed with different ratios and further diluted to various concentrations. The final concentrations of the red and blue dyes are denoted by [red] and [blue], respectively. Each mixed dye solution was injected into a transparent polymer tube with an inner diameter of and a thickness of . The penetration depths of light in the studied dye phantoms and blood samples were larger than the inner diameter of the tube. A diagram of the experiments on dye phantoms and in vitro rat blood samples is shown in Fig. 2(A). The tube filled with dye (or blood) was immersed in the water. The laser beam at 580 and , respectively, irradiated the tube along the axis. The transducer received the laser-generated photoacoustic signals in the horizontal plane. A typical photoacoustic signal trace is shown in Fig. 2(B). As shown in Eq. 3, when the light energy density in the sample is constant, the intensity of the photoacoustic signal is proportional to the optical absorption of the sample at the applied wavelength. In this case, the photoacoustic signal intensities at the two wavelengths, and , can substitute for and in Eqs. 5, 6. For each mixed dye solution, two parameters were calculated, including (1) the total dye concentration, [red]+[blue] and (2) the fraction of the red dye concentration in the total dye concentration, [red]/([red]+[blue]). In the photoacoustic experiments on dye phantoms and in vitro rat blood specimens, the samples were placed in the water, a nonscattering medium, which was different from the situation in PAT of in vivo rat brains. However, this study can successfully prove the mechanism in spectroscopic PAT employing multiple wavelengths: when the light energy densities in an object are the same at applied wavelengths (after normalization), the intensities of optical absorption in the objects measured through the photoacoustic detection enable the calculation of relative concentrations of chromophores in the object. Fig. 2(A) Diagram of the PAT experiments on dye phantoms and in vitro rat blood samples and (B) typical photoacoustic signal trace.  In one experiment for testing the simulated sensitivity of this PAT system to HbT, we first made three mother liquids of mixed dyes, where the ratios between [red] and [blue] were 3:1, 1:1, and 1:3, respectively. Then each mother liquid was diluted with water to achieve 10 different concentrations evenly distributed from 10 to 100%. In the three charts in Fig. 3(A), where the results corresponding to the three mother liquids are presented respectively, the axes show the measured total dye concentrations, [red]+[blue], which match well the preset concentrations on the axes. The ratio between [red] and [blue] shows no effect on the measurement of the total dye concentration. Fig. 3Photoacoustic measurement of (A) the total dye concentration, [red]+[blue], in each mixed dye solution containing Fiesta Red and Lake Placid Blue, where the ratios between [red] and [blue] are 3:1, 1:1, and 1:3, respectively, in the three charts; (B) the fraction of the red dye concentration in the total dye concentration, [red]/([red]+[blue]), in each mixed dye solution; and (C) the oxygen saturation of hemoglobin in rat blood samples in vitro.  In another experiment for testing the simulated sensitivity of this PAT system to , mixed dye solutions with different ratios between [red] and [blue] were measured, where the fraction of [red]/([red]+[blue]) changed from 0 to 100% with a constant interval of 10%. The measurements in Fig. 3(B) match well with the preset fractions of [red]/([red]+[blue]). The experimental results on the phantom samples proved the capability of this PAT system to discriminate mixed absorbing materials based on their distinct absorption spectra. 2.5.Measurement of Blood In VitroThe spectroscopic PAT system was also applied to measuring the levels of rat blood samples in vitro. A blood sample with a high level was collected from the heart of a rat that was provided with pure oxygen and another blood sample with a low level was collected from the heart of a rat whose breath was held. Each sample was diluted 1:5 with phosphate-buffered saline containing anticoagulant. These two diluted blood samples were mixed at different ratios to achieve various levels from 64.1 to 95.0%, measured by a (Irma 2000 SL, Diametrics). Then, each mixed blood sample was injected into the 0.2-mm-inner-diam transparent tube and measured by the PAT system at two wavelengths, 580 and , respectively. With the detected intensities of the photoacoustic signals at the two wavelengths, we calculated the level of each mixed blood sample, which, after a linear calibration with the two end-points, matched well with the measurements of the [see Fig. 3(C)]. 2.6.Animal ProtocolWe performed functional photoacoustic imaging of rat brains in vivo to demonstrate the capability of this technique for simultaneously assessing the cerebral blood volume and the oxygenation level of hemoglobin. Sprague Dawley rats ( , Charles River Breeding Laboratories) were employed in this study. All experimental animal procedures were carried out in conformity with the guidelines of the United States National Institutes of Health.30 The laboratory animal protocol for this work was approved by the University Laboratory Animal Care Committee of Texas A&M University. Before imaging, the hair on the head of the rat was removed using hair remover lotion. A dose of ketamine plus xylasine , administered intramuscularly, was used to anesthetize the rat and supplemental injections of a similar anesthetic mixture kept the rat motionless throughout the experiment. The rat head, fixed steadily by a homemade animal holder and a breathing mask, protruded up into a water tank through a hole in the bottom of the tank. A piece of clear membrane between the water and the rat head sealed the hole. Through the breathing mask, inhaled gas was ventilated to the rat at a flow rate of . The oxygen concentration in the inhaled gas was adjustable through a gas proportioner meter (GMR2, Aalborg). During the experiment, the sensor of a pulse oximeter ( , Nonin Medical, Inc.) clamped a hind foot of the rat to monitor the global arterial blood oxygenation. Through the modulation of the inhaled oxygen concentration, the rat experienced three systemic physiological statuses—hyperoxia, normoxia, and hypoxia. Under each status, laser light at 584 and were applied, respectively, to generate two photoacoustic images of the cerebral cortex. To acquire the photoacoustic signals for each image, the transducer scanned circularly in the horizontal plane around the cerebral cortex at the dorsal part of the brain with 226 steps that covered . At each scanning position, 30 laser pulses were applied for signal averaging. The period for signal acquisition for each image was about . The in vivo experiment on the rat brain was performed as follows. First, the rat was provided with pure oxygen and its global arterial blood oxygenation was according to the pulse oximeter. Under this hyperoxia condition, two images of the brain cerebral cortex corresponding to the two wavelengths were acquired. Then, the inhaled gas was altered slowly from pure oxygen to normal air. The status of the rat changed from the hyperoxia to the normoxia and the arterial blood oxygenation dropped to . We also acquired two brain images under the normoxia status corresponding to the same two wavelengths. Subsequently, the inhaled gas was altered slowly to hypoxic gas ( , and ) and the arterial blood oxygenation of the rat decreased to . Another two brain images corresponding to the two wavelengths were acquired under this hypoxia status. Hence, in total, we acquired six images corresponding to the three statuses at each of the two wavelengths. After the data acquisition for imaging, the rat recovered normally without noticeable health problems. Finally, the rat was sacrificed using pentobarbital [( , Intra-peritoneal (IP)]. The skin and skull of the rat were removed and an open-skull photograph of the brain cortex was taken as a control. 3.ResultsFigures 4(A) and 4(B) are the images of the rat brain cerebral cortex under the normoxia status at the 584- and 600-nm wavelengths, respectively. The brain images acquired under the hyperoxia and hypoxia statuses (not shown) present the same vascular structure but different magnitudes of optical absorption. With high absorption contrast between the blood and background brain tissues, all of the brain images show the vascular branches in the cerebral cortex clearly and match well with the open-skull anatomical photograph taken after the photoacoustic image acquisition [see Fig. 4(I)]. All the imaged large vascular branches were cortical venous vessels. Before the calculations for HbT and , the areas of cortical venous vessels were segmented from the background. The threshold was the averaged intensity of the relative optical absorption in the imaged brain area. Then, with Eqs. 5, 6, we calculated the and HbT in the areas of the cortical venous vessels under the three physiological statuses. For example, the images of and HbT under the normoxia status are shown in Figs. 4(C) and 4(D), respectively, where the gray scale for the image indicates the absolute value while the gray scale for the HbT image shows an arbitrary unit. The averaged levels in the imaged venous vessels were and under the hyperoxia, normoxia, and hypoxia statuses, respectively. Fig. 4Noninvasive spectroscopic photoacoustic imaging of the total concentration of hemoglobin (HbT) and the hemoglobin oxygen saturation in the cerebral cortex of a rat brain. (A) and (B) Brain images generated by 584- and 600-nm laser light, respectively, under the normoxia status; (C) and (D) images of and HbT in the areas of cortical venous vessels under the normoxia status; (E) image of the averaged differential , in the cortical venous vessels between the hyperoxia status and the normoxia status; (F) image of the averaged differential , in the cortical venous vessels between the hypoxia status and the normoxia status; (G) image of the averaged fractional change in HbT, , in the cortical venous vessels between the hyperoxia status and the normoxia status; (H) image of the averaged fractional change in HbT, , in the cortical venous vessels between the hypoxia status and the normoxia status; and (I) open-skull anatomical photograph of the rat brain cerebral cortex taken after the photoacoustic imaging experiment.   Based on the spectroscopic PAT, the functional changes of and HbT in the rat cerebral cortex as a result of the physiological modulations can be analyzed. Under the hyperoxia status, the averaged level, , in the areas of the imaged cortical venous vessels in the rat brain, was higher than that under the normoxia status and the difference was ; while under the hypoxia status, the was lower than that under the normoxia status and the difference was [see Figs. 4(E) and 4(F)]. Simultaneously, the averaged HbT value, in the areas of the imaged cortical venous vessels, presented a relative increase of , denoted by , as a result of the change from the normoxia to the hypoxia, which was comparatively larger than the relative increase in as a result of the change from the hyperoxia status to the normoxia status [see Figs. 4(G) and 4(H)]. The functional images in Figs. 4(E) to 4(H) are superimposed on the structural image of the cortical vasculature shown in Fig. 4(B). The spectroscopic PAT experiments on a group of three Sprague Dawley rats with similar body weights presented consistent functional trends. The ranges of under the hyperoxia, normoxia, and hypoxia statuses were 80 to 86, 70 to 77, and 57 to 61%, respectively. In changing from the normoxia to the hyperoxia and from the normoxia to the hypoxia, the ranges of were and , respectively; while the ranges of the were and , respectively. The phenomena observed in this study agree with the well-established physiology of the brain.31, 32 4.DiscussionThis paper demonstrated the feasibility of multiwavelength (spectroscopic) laser-based PAT for functional imaging of cerebral hemoglobin concentration and hemoglobin oxygenation noninvasively through the intact skin and skull. With spatial resolution that is much improved compared to diffuse optical technologies, PAT can assess functional parameters and changes in localized areas in the brain. The PAT technique described here can potentially provide important new insights into cerebrovascular physiology and brain function that should be of great significance to the neuroscience community. Studying the hemodynamics and oxygen metabolism in the brain in greater detail requires further investigation. First, optical parameters that affect the distribution of optical energy in the brain, such as the absorption, scattering, and refractive index of the skin, skull, and brain tissues as functions of wavelength, must be studied. Second, 2-D acquisition of photoacoustic signals that enables 3-D brain imaging should be implemented to improve the depth resolution and, hence, improve the accuracy of the functional measurements. Third, an ultrasonic transducer array should be used for signal acquisition not only to enable real-time imaging but also to effectively avoid errors caused by the instability of laser energy and motions of the animals. Fourth, other sources of noise including reconstruction error and systematic noise due to the preamplifier and the digitizer must be reduced to further improve the sensitivity and accuracy in functional imaging. Fifth, photoacoustic measurements at additional wavelengths should be conducted to isolate any impact from less significant chromophores, such as cytochrome oxidase and water. Finally, to translate this PAT technique to imaging of human brains, near-IR light between 700 and should be applied for maximum penetration. AcknowledgmentsThis study was sponsored in part by the National Institutes of Health (NIH), the Department of Defense (DOD), and the Texas Advanced Research Program. ReferencesG. A. Millikan,
“The oximeter, an instrument for measuring continuously the oxygen saturation of arterial blood in man,”
Rev. Sci. Instrum., 13 434
–444
(1942). https://doi.org/10.1063/1.1769941 0034-6748 Google Scholar
F. F. Jöbsis,
“Noninvasive, infrared monitoring of cerebral and myocardial oxygen sufficiency and circulatory parameters,”
Science, 198 1264
–1267
(1977). 0036-8075 Google Scholar
A. Villringer and
B. Chance,
“Non-invasive optical spectroscopy and imaging of human brain function,”
Trends Neurosci., 20 435
–442
(1997). https://doi.org/10.1016/S0166-2236(97)01132-6 0166-2236 Google Scholar
A. A. Oraevsky,
S. L. Jacques,
R. O. Esenaliev, and
F. K. Tittel,
“Laser based optoacoustic imaging in biological tissues,”
Proc. SPIE, 2134A 122
–128
(1994). 0277-786X Google Scholar
R. A. Kruger,
“Photoacoustic ultrasound,”
Med. Phys., 21 127
–131
(1994). https://doi.org/10.1118/1.597367 0094-2405 Google Scholar
A. A. Oraevsky,
R. O Esenaliev,
S. L. Jacques,
S. Thomsen, and
F. K. Tittel,
“Lateral and -axial resolution in laser optoacoustic imaging with ultrasonic transducers,”
Proc. SPIE, 2389 198
–208
(1995). 0277-786X Google Scholar
R. A. Kruger and
P. Liu,
“Photoacoustic ultrasound reconstruction tomography,”
Med. Phys., 22 1605
–1609
(1995). https://doi.org/10.1118/1.597429 0094-2405 Google Scholar
C. G. A. Hoelen,
F. F. M. de Mul,
R. Pongers, and
A. Dekker,
“Three-dimensional photoacoustic imaging of blood vessels in tissue,”
Opt. Lett., 23 648
–650
(1998). 0146-9592 Google Scholar
R. O. Esenaliev,
A. A. Karabutov, and
A. A. Oraevsky,
“Sensitivity of laser opto-acoustic imaging in detection of small deeply embedded tumors,”
IEEE J. Sel. Top. Quantum Electron., 5 981
–988
(1999). https://doi.org/10.1109/2944.796320 1077-260X Google Scholar
A. A. Oraevsky and
A. A. Karabutov,
“Optoacoustic tomography,”
34/1
–34/34
(2003). Google Scholar
V. G. Andreev,
A. A. Karabutov, and
A. A. Oraevsky,
“Detection of ultrawide-band ultrasound pulses in optoacoustic tomography,”
IEEE Trans. Ultrason. Ferroelectr. Freq. Control, 50 1383
–1390
(2003). https://doi.org/10.1109/TUFFC.2003.1244756 0885-3010 Google Scholar
R. G. M. Kolkman,
E. Hondebrink,
W. Steenbergen, and
F. F. M. de Mul,
“In vivo photoacoustic imaging of blood vessels using an extreme-narrow aperture sensor,”
IEEE J. Sel. Top. Quantum Electron., 9 343
–346
(2003). https://doi.org/10.1109/JSTQE.2003.813302 1077-260X Google Scholar
R. A. Kruger,
W. L. Kiser,
D. R. Reinecke,
G. A. Kruger, and
K. D. Miller,
“Thermoacoustic molecular imaging of small animals,”
Mol. Imaging, 2 113
–123
(2003). https://doi.org/10.1162/153535003322331993 1535-3508 Google Scholar
X. Wang,
Y. Pang,
G. Ku,
X. Xie,
G. Stoica, and
L. V. Wang,
“Non-invasive laser-induced photoacoustic tomography for structural and functional imaging of the brain in vivo,”
Nat. Biotechnol., 21 803
–806
(2003). https://doi.org/10.1038/nbt839 1087-0156 Google Scholar
X. Wang,
Y. Pang,
G. Ku,
G. Stoica, and
L. V. Wang,
“Three-dimensional laser-induced photoacoustic tomography of the mouse brain with the skin and skull intact,”
Opt. Lett., 28 1739
–1741
(2003). 0146-9592 Google Scholar
X. Wang,
G. Ku,
M. A. Wegiel,
D. J. Bornhop,
G. Stoica, and
L. V. Wang,
“Noninvasive photoacoustic angiography of animal brains in vivo with near-infrared light and an optical contrast agent,”
Opt. Lett., 29 730
–732
(2004). https://doi.org/10.1364/OL.29.000730 0146-9592 Google Scholar
R. Fainchtein,
B. J. Stoyanov,
J. C. Murphy,
D. A. Wilson, and
D. F. Hanley,
“Local determination of hemoglobin concentration and degree of oxygenation in tissue by pulsed photoacoustic spectroscopy,”
Proc. SPIE, 3916 19
–33
(2000). 0277-786X Google Scholar
R. O. Esenaliev,
I. V. Larina,
K. V. Larin,
D. J. Deyo,
M. Motamedi, and
D. S. Prough,
“Optoacoustic technique for noninvasive monitoring of blood oxygenation: a feasibility study,”
Appl. Opt., 41 4722
–4731
(2002). 0003-6935 Google Scholar
American National Standards Institute,
(2000). Google Scholar
G. J. Diebold,
T. Sun, and
M. I. Khan,
“Photoacoustic waveforms generated by fluid bodies,”
263
–269
(1992). Google Scholar
M. Xu and
L. V. Wang,
“Time-domain reconstruction for thermoacoustic tomography in a spherical geometry,”
IEEE Trans. Med. Imaging, 21 814
–822
(2002). https://doi.org/10.1109/TMI.2002.801176 0278-0062 Google Scholar
M. Xu and
L. V. Wang,
“Analytic explanation of spatial resolution related to bandwidth and detector aperture size in thermoacoustic or photoacoustic reconstruction,”
Phys. Rev. E, 67 1
–15
(2003). https://doi.org/10.1103/PhysRevE.67.046314 1063-651X Google Scholar
G. Ku,
X. Wang,
G. Stoica, and
L. V. Wang,
“Multiple-bandwidth photoacoustic tomography,”
Phys. Med. Biol., 49 1329
–1338
(2004). https://doi.org/10.1088/0031-9155/49/7/018 0031-9155 Google Scholar
B. Chance,
E. Borer,
A. Evans,
G. Holtom,
J. Kent,
M. Maris,
K. Mccully,
J. Northrop, and
M. Shinkwin,
“Optical and nuclear-magnetic-resonance studies of hypoxia in human tissue and tumors,”
Ann. N.Y. Acad. Sci., 551 1
–16
(1988). 0077-8923 Google Scholar
R. L. Barbour,
A. Gebrewold, and
B. M. Altura,
“Optical spectroscopy and cerebral vascular effects of alcohol in the intact brain: effects on tissue deoxyhemoglobin, blood content, and reduced cytochrome oxidase,”
Alcohol Clin. Exp. Res., 17 1319
–1324
(1993). 0145-6008 Google Scholar
H. Liu,
D. A. Boas,
Y. Zhang,
A. G. Yodh, and
B. Chance,
“Determination of optical properties and blood oxygenation in tissue using continuous NIR light,”
Phys. Med. Biol., 40 1983
–1993
(1995). https://doi.org/10.1088/0031-9155/40/11/015 0031-9155 Google Scholar
E. Gratton,
S. Fantini,
M. A. Franceschini,
G. Gratton, and
M. Fabiani,
“Measurements of scattering and absorption changes in muscle and brain,”
Philos. Trans. R. Soc. London, Ser. B, 352 727
–735
(1997). https://doi.org/10.1098/rstb.1997.0055 0962-8436 Google Scholar
P. VanderZee,
M. Essenpreis, and
D. T. Delpy,
“Optical properties of brain tissue,”
Proc. SPIE, 1888 454
–465
(1993). 0277-786X Google Scholar
A. K. Kunn,
A. Devor,
H. Bolay,
M. L. Andermann,
M. A. Moskowitz,
A. M. Dale, and
D. A. Boas,
“Simultaneous imaging of total cerebral hemoglobin concentration, oxygenation, and blood flow during functional activation,”
Opt. Lett., 28 28
–30
(2003). 0146-9592 Google Scholar
U.S. National Institutes of Health,
(1985). Google Scholar
S. S. Kety and
C. F. Schmidt,
“The effects of altered arterial tensions of carbon dioxide and oxygen on cerebral blood flow and cerebral oxygen consumption of normal young men,”
J. Clin. Invest., 27 484
–491
(1948). 0021-9738 Google Scholar
T. Q. Duong,
C. Iadecola, and
S. G. Kim,
“Effect of hyperoxia, hypercapnia, and hypoxia on cerebral interstitial oxygen tension and cerebral blood flow,”
Magn. Reson. Med., 45 61
–70
(2001). 0740-3194 Google Scholar
|