
|
|
1.IntroductionThe study of cardiogenesis is of considerable interest in biological and medical research. Abnormalities in early vertebrate heart development are the leading form of congenital birth defects. It is well known that genetic regulation plays an important role in heart development. Recent studies have revealed that the shear stress induced by blood flow can cause changes in endothelial cell alignment,1 blood vessel formation,2, 3 and cardiogenesis.4, 5 In addition, the biomechanical forces are also considered to be factors in the pathogenesis of cardiovascular diseases.6, 7 All these studies suggest that fluid mechanical forces produced by blood flow are essential to the proper development and maintenance of early embryonic hearts as well. While effects of genetics have been intensely studied using gene targeting approaches,8 an understanding of hemodynamics and cell migration is particularly limited. This is largely due to the fact that there are no existing imaging tools with sufficient spatial and temporal resolution to quantify embryonic blood flow. Substantial efforts have been made to quantitatively measure blood flow velocity and blood-flow-induced fluid forces such as shear stress. Research has been done in vitro to help understand how biological systems react to biofluid flow-induced shear stress,9 stretch,10 and pressure.11 However, these in vitro experiments can only partially describe the complexity of biological flows, and hardly simulate biochemical interactions between living tissues. While in vivo imaging techniques such as magnetic resonance imaging (MRI)12, 13 and positron emission tomography (PET)14, 15 can operate reasonably well in some instances, none of them can provide instantaneous velocity fields at an adequate spatial and temporal resolution to quantify highly dynamic microscale flows. Remarkable advances recently have been made in acquiring high-speed 3-D data through confocal microscopy. Liebling 16 took advantage of confocal laser scanning microscopy (CLSM) to reconstruct dynamic 3-D volume of living biological systems by consecutively scanning the volumetric structures rapidly from one spatial slice to another through the use of a periodically moving objective lens and synchronizing successive optical sections. However, there are still three fundamental limitations on the application of this technique: 1. 3-D volume can be correctly recovered only if the dynamic motion is periodic (such as heart beat). Synchronization of slice-sequence pairs, the core procedure to reconstruct 3-D volume, requires periodic boundary conditions to maximize the similarity between two adjacent slices. Consequently, the dynamic motions being imaged have to be periodic as well. Therefore, not all possible motions in living biological systems can be imaged using this technique. 2. The scanning rate of a CLSM system is limited to about 200 frames per second with a resolution. While the technique is typically applicable to some in vivo dynamic processes (e.g., cell migration, heart-wall motions, etc.) imaging, it may not be capable of providing sufficient speed or resolution to study all possible motions in living systems. 3. This resulting reconstruction does not provide real-time information of motions within this volume. As the two adjacent slices were scanned at different times, cells that were imaged in the first optical slice may not be present in the second one, owing to the time delay between imaging the two slices. The recovered 3-D structure can only provide qualitative information of how cells move. And quantitative analysis of cell motions, such as velocity measurements of blood flow and moving organs, is not accessible by using this technique, owing to the lack of real-time motion information. As a result, the CLSM imaging system cannot be applied with fluid diagnostic tools such as particle image velocimetry (PIV)17 and particle tracking velocimetry (PTV)18 for quantitative dynamic motions imaging and mapping. PIV/PTV is generally able to quantitatively map flow motions in all complicated cases. The basic mechanism to measure flow velocity vectors is by measuring the differential lengths of the vector shifts of neutral flow tracers between two adjacent video frames acquired during visualization. Besides their successful application to macroscale flow mapping, -PIV19 and -PTV20 systems have been established to map microscale flows at a spatial resolution in the order of hundreds of nanometers. High-speed cameras were used in these systems to capture video frames, providing sufficient temporal resolution. These techniques have been used in biological flow imaging as well. Hove 21 used PIV to measure velocity fields in zebrafish cardiovascular flow. Vennemann 22 measured blood-plasma velocity distribution in the embryonic avian heart. While -PIV/PTV systems are now well applied, their use in biological systems is so far limited to 2-D flow measurements. However, most biological cell motions have complex 3-D characteristics, requiring 3-D quantitative mapping techniques to adequately describe the motions. Here we present a high-speed microscope-based 3-D (plus time) imaging methodology capable of quantifying cell motions within any optically accessible organ system. An extension of PIV/PTV called defocusing digital particle image velocimetry (DDPIV)23 was applied to build the imaging system. The system is capable of measuring velocity fields in many complicated in vivo cell motions, with 3-D optical data being acquired simultaneously to provide real-time information. Zebrafish are considered an ideal model for the study of in vivo cardiac cell motions (e.g., blood flow, heart-wall motions, etc.) due to their small size, optical accessibility, and rapid, external fertilization. 3-D velocity fields of in vivo blood flow and wall motions in embryonic zebrafish heart are presented. 2.Results2.1.Microscopic Defocusing Digital Particle Image Velocimetry PrincipleOur high-speed 3-D microscopic imaging system is based on the defocusing concept. In a standard 2-D imaging system, the light scattered by a point source is collected through a converging lens and a single aperture, forming the corresponding (and single) image. In contrast, DDPIV uses a mask with two or more apertures; hence a multiplicity of images is generated for any single point source. A simple DDPIV imaging system, consisting of a mask with two apertures separated by a distance , is shown in Fig. 1a . Point light source , located on the object focal plane (or reference plane), is imaged on the image plane as a focused point. As the point is moved out of the focal plane to position , it is focused on a point located out of the image plane. However, because of the two-aperture mask attached to the converging lens, two images and are generated on the image plane, separated by a distance . Fig. 1Principle and experimental setup. (a) Schematic of the defocusing principle (DDPIV). (b) Schematic of the 3-D high-speed microscopic imaging experimental setup.  As shown by Pereira and Gharib,23 the depth coordinate of point is related to the separation between its defocused image and . Given the focal distance between the focal plane and the aperture plane, the distance between the two apertures, and the optical magnification of the system, the relationship between coordinate and distance can be determined by geometrical analysis as: However, for a microscopic system, the actual optical properties of the objective lens are not generally accessible. In addition, the axial position of the objective optical center, and therefore of the aperture plane, cannot be explicitly measured in absolute terms.Consequently, the geometrical analysis of a general DDPIV system is not applicable for a 3-D microscopic imaging system. Even though the focal distance in the imaging system cannot be directly measured, nor is dependent on known parameters, they can still be determined experimentally. One can rewrite Eq. 1 as: According to Fig. 1a, the depth coordinate is not practically measurable due to the unknown axial position of the objective lens. To overcome this difficulty, we introduce the relative distance of point to the focal plane as . Equation 2 can then be written as:The relative distance originates on the focal plane. This plane can be easily and accurately located if one, by means of a precision -translation stage, moves a point light source along the axis until its multiple images overlap . This position corresponds to .Given that and are known parameters, the image separation can be easily measured at precisely controlled distances , and consequently the focal distance follows as per Eq. 3. In our experiments, the focal distance has been calibrated statistically by this means (see Sec. 4, Materials and Methods). Therefore, the complex microscopic system has been reduced to an equivalent general DDPIV optical system, for which Eq. 1 can now be used to calculate the depth coordinate . Hence the 3-D coordinates of a point off the focal plane are now fully determined by this technique, since the remaining coordinates and are easily resolved from the centroid of the multiple images and on the image plane. In practice, a two-aperture mask introduces ambiguities, since the line pattern has no privileged orientation. For instance, two particles ( and ) aligned parallel to the line connecting the two apertures in the mask will generate two defocused image pairs ( and ) aligned in a straight line. However, matching the four defocused images produces six possible image pairs (i.e., , , , , , and ). Hence there is high probability to mismatch the defocused images and to generate particles that never existed. For this reason, a mask with three apertures forming an equilateral triangle was adopted, in which case the resulting triple-image pattern of a particle can be unambiguously identified. 2.2.Experimental SetupA schematic of the experimental setup of the 3-D imaging system is shown in Fig. 1b. The system is composed of an inverted microscope, a -translation stage, a three-aperture mask, an argon-ion laser, and a high speed camera. An inverted microscope (Nikon, Eclipse TE2000-S) was utilized to enable microscale flow imaging. A mask with three apertures forming an equilateral triangle was attached to the back of a objective lens (Nikon Plan Apo, ). The diameter of the apertures is , and the separation between each two apertures is . Fluorescence microscopy was adopted with yellow-green fluorescent polystyrene microspheres (Molecular , FluoSpheres, USA) as the flow tracers. The particles were excited, through the regular bright-field illumination path of the microscope, by the 488-nm spectral line of a 5-W argon-ion laser, their emission line being at 515 nm. Time series of DDPIV images were recorded using a high-speed, complementary metal oxide semiconductor camera with a resolution of capable of a recording frame rate of up to 2000 frames per second (fps) at full resolution (Photron, APX Ultima). 2.3.Calibrationfluorescent microspheres were chosen as the calibration targets, as they were also the working tracer particles for the zebrafish blood flow imaging experiments. Targets were mounted on a cover glass and placed underneath the microscope (see Materials and Methods in Sec. 4 for details). In video microscopy,24 diffraction and spherical aberration are a source of image distortion. To account for this in the calibration, targets were spread over the whole field of view, allowing us to have ensemble statistics for the image separation and consequently for . These measurements are repeated at various distances . Sample defocused images of calibration targets at different relative distances are shown in Fig. 2 . The resolution of the image is per pixel. Fig. 2Defocused images of microspheres calibrated at various locations. (a) Focal plane ; (b) defocusing plane ; and (c) defocusing plane . Sample defocusing patterns are linked as triangles in (b) and (c).  Figure 3 shows the calibrated mean values of the image separation and the corresponding focal distance , as a function of the relative position . The total depth range of the current 3-D imaging system is . The sensitivity of depth position is defined as the image separation change for a given spatial displacement, which is 0.944 pixel for displacement in the present imaging system. A subpixel detection algorithm23 was used to calculate the image coordinates of particle centroids, thereby the depth resolution of the 3-D imaging system is in the order of .25 It can also be observed that the calibrated values of the focal distance are found to be independent on the depth coordinates as expected. 2.4.In Vivo Imaging of Cardiac Cell Motions in ZebrafishA very small volume (e.g., picoliters) of fluorescent microspheres was injected into the blood stream of a zebrafish embryo immobilized by a drop of 1% agarose gel at post-fertilization (hpf) and 48 hpf, respectively (see Materials and Methods in Sec. 4). The zebrafish embryonic heart is composed of two chambers, i.e., atrium and ventricle. Each chamber is about in diameter and longitudinally. A 32-hpf heart is a straight tube, with a two-part heartbeat indicating the formation of two chambers. At 48 hpf, the heart tube bends to separate the two chambers. Because direct injection of particles into the developing heart may cause serious damage to the cardiac muscle and impact the physics of normal cardiac cell motions, microinjection was performed at blood vessels in the tail of the embryo to minimize the potential influence. Tracer particles then entered the heart through the circulatory system. It has been observed that injected polystyrene microspheres are likely to aggregate or to be trapped by the walls of blood vessels within minutes after injection. In heart-wall motions imaging experiments, the microspheres trapped in the heart were used as tracers to describe heart-wall motions. However, particle trapping by heart walls may significantly affect their ability to function optimally as cardiovascular flow tracers. In blood flow imaging experiments, the test zebrafish embryo was immediately moved to the modified microscopic setup for imaging after a successful injection. Defocused image patterns of in vivo cardiac cell motions were recorded by the high-speed camera. Although microinjection was carefully performed, some particles already adhered to the surrounding tissues outside of the heart, generating a nonuniform background in the images. Therefore, images were processed prior to identifying the particles by their self-similar triangular image patterns. Figure 4 shows a sample of the image processing. A single image frame [Fig. 4a] among a raw image sequence showing blood flow in the yolk sac of a 32-hpf embryo included both particles in the blood stream and those trapped by the tissues. Fluorescent image patterns of the particles on the tissues were considered as the background, and needed to be separated from the particles of interest in the blood to measure the flow velocities. Since the surrounding tissues were stationary during the experiment, the background particles existed in the same positions of every frame among an image sequence, while the particles moving in the blood were present in different locations. Therefore, the average intensity of the entire sequence only contains the background [Fig. 4b], which was initially calculated using ImageJ (National Institutes of Health, Bethesda, Maryland) and was then subtracted from every single image frame. After background removal, an image frame only contains signals of particles in the blood stream. The typical signal-to-noise ratio of the recorded images was . Particle image detection in our experiments was then performed, following the procedures of Pereira and Gharib23: low-pass filtering, particle subpixel detection, particle 2-D Gaussian modeling, and noise removal were performed to further improve the image quality, followed by triangle pattern matching to find the 3-D coordinates of the tracer particles. 2.5.Particle TrackingPTV, a commonly used method in fluid mechanics, was applied to obtain the velocity field after the 3-D particle position was resolved. It tracks individual particle images in consecutive image frames, and computes the directionally resolved vector for each matched particle. A tracking algorithm called a relaxation scheme26 has been used in this study. The basic concept of particle tracking in this algorithm is to search for the most probable link of a given particle, while assuming similar displacements of its neighbor particles (the so-called quasi-rigidity condition), within a neighborhood of specified size. Thus, the search for the matching particle in the next image frame is made in the direction that the neighbor particles are most likely pointing to, since it is legitimate to believe that the corresponding matching particle lies preferably in that direction. In an iterative process, the correct link probability is gradually increased close to unity, while the other probabilities tend to zero. After successful termination of this iterative process, the correct particle link is the one with the highest probability. There is a criterion in the PTV method that requires the distance between tracer particles to be larger than the displacement. Since the high-speed image acquisition was used in the system and particle density was low in the images, the distance of a particle traveled between two consecutive time frames is smaller than the separation between particles, even though the cell motions in a beating zebrafish heart are highly dynamic. Hence, the criterion was met and PTV is capable of obtaining 3-D velocity vectors from the images. In addition, the recorded image sequences described continuous movements of each particle (i.e., no strong displacement gradient exists between every two consecutive images), and most particle links can thereby be correctly found. So the complex velocity fields inside the zebrafish heart can be reconstructed. 3-D velocity fields of tracer particles in the blood stream and on the heart wall were resolved by PTV. Figure 5 shows the blood flow velocity fields of a 32-hpf embryo. The blood in the yolk sac is seen to be moving first upward, then following a downward direction as the yolk sac is approximately spherical [Fig. 5a]. Images of six tracer particles inside the cardiovascular flow were captured at the same instance [Fig. 5b]. Forward flow velocity in the atrium during diastole was about , which is consistent with the measurements of Forouhar 27 Trajectories of tracer particles trapped in the wall of the atrium and the ventricle of a 32-hpf embryo were obtained [Fig. 6 ]. Three-dimensional positions of the two particles in a cardiac cycle demonstrated the phase difference between the atrium and the ventricle in a beating heart. One can also observe that the wall motion in the ventricle is more active and more complex than that in the atrium. The shape of ventricle-motion trajectories is similar with what Forouhar 27 obtained as well. A 48-hpf zebrafish heart was labeled by a few tracer particles in the wall (Video 1). Defocusing image patterns were recorded at 125 fps. The reconstructed 3-D positions and velocities of the particles demonstrated the movement of the ventricle during a complete cardiac cycle (Video 2 ). Fig. 53-D PTV results of blood flow. (a) Mean velocity field of blood flow in the yolk sac of an embryonic zebrafish. (b) Instantaneous velocities and spatial positions of six tracer particles in the atrium during diastole. Vector arrows indicate velocity directions, with colors representing velocity magnitudes. Defocusing images were recorded at 500 fps.  Fig. 63-D PTV results of heart-wall motions. (a) Defocusing images of the trapped tracer particles during a cardiac cycle. The two bright image triplets originated from the tracer particles of interest in the heart wall, with the ventricle on the left side and the atrium on the right. The heart rate was about . Images were recorded at 60 fps. (b) Trajectory of the tracer particle in the ventricle wall within two cardiac cycles. (c) Trajectory of the tracer particle in the atrium wall within two cardiac cycles. The spheres stand for positions of the injected tracer particles, with colors representing velocity magnitudes and vector arrows indicating velocity directions. The big sphere in each image indicates the particle position at the corresponding time instance.  Video 1A beating 48-hpf zebrafish heart labeled by injected tracer particles. Defocusing image patterns form upright triangles (QuickTime, ). 1. 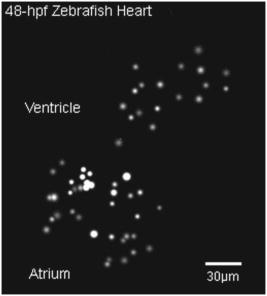 Video 2Reconstruction of the beating ventricle in Video 1. Velocity magnitudes are color coded and vector arrows represent velocity directions (QuickTime, ). 2;.  3.Conclusion and DiscussionWe have successfully built a high-speed 3-D microscopic imaging system based on the defocusing technique (DDPIV) with laser-induced fluorescence to provide quantitative analysis on microscale cardiac cell motions in living zebrafish embryos. The current microscopic imaging system is capable of resolving 3-D spatial information by recording the defocused image patterns produced by the flow tracers. The technique is validated by a calibration procedure. Calculation of 3-D spatial coordinates by the defocusing concept does not require any information (such as motion period) of the imaged motion. The microscope is equipped with a high-speed camera acquiring data at up to several thousand frames per second, providing sufficient speed to acquire fast-moving motions. Additionally, all the 3-D data were resolved by this method without any time delay, as triangular pattern matching was performed at each single defocused image. Therefore, the calculated 3-D information provides real-time information inside a microscopic volume of interest. Given objective lenses with appropriate magnifications and optimal tracers, the system is suited for quantitative analysis of dynamic motions in a wide range of living systems. Injected tracer particles adhered to the heart wall may affect the blood flow measurements in the heart. These particles always followed the same trajectories throughout several cardiac cycles, as Fig. 6 shows, while particles in the blood stream moved out of the heart after a complete heartbeat. Therefore, particles in the heart wall can be easily identified through an image sequence where a few cardiac cycles were recorded. The trapped particles were subtracted from the images, and a separate flow measurement could be performed with the tracer particles circulating in the blood. 4.Materials and Methods4.1.Target Preparation and Calibrationyellow-green fluorescent microspheres (Molecular , FluoSpheres, USA) were initially diluted into preheated 1% ultra-low melting temperature agarose (Sigma-Aldrich, Saint Louis, Missouri) in 30% Danieau solution. One small droplet of the diluted solution was placed on a cover glass. We then put another cover glass over the droplet, and pressed the two cover glasses tightly, allowing the agarose solution to cool within minutes. Afterward, fluorescent targets were spread over the cover glasses. The cover glasses were moved in steps of along the axis using a precision translation stage, starting from the focal plane , where the triangular image patterns are reduced to points up to a position where particle detection was not possible. 4.2.Embryo Preparation and MicroinjectionWild-type zebrafish embryos were raised at 28.5°C in 30% Danieau solution. At 32 hpf (or 48 hpf), embryos were dechorionated, and anaesthetized with 0.02% tricaine in 30% Danieau solution. The test embryos were transferred to 1% agarose, and then pipetted in a drop of agarose on a chilled cover glass to facilitate particles injection. The orientation of the embryos was manually adjusted to expose the blood vessels in the tail, through the use of a small capillary tube. Embryos were appropriately positioned and mounted on the cover glass within minutes. Fluidized yellow-green fluorescent microspheres were loaded into a micropipette with an approximately tip, connected with a Pico-Spritzer assembly (General Valve PLC-100). The test embryo was placed underneath a Zeiss Stemi SV 11 dissecting microscope for observation. The micropipette tip penetrated the skin to inject the tracer particles into the blood vessels. ReferencesG. Garcia-Cardena,
J. Comander,
K. R. Anderson,
B. R. Blackman, and
M. A. Gimbrone,
“Biomechanical activation of vascular endothelium as a determinant of its functional phenotype,”
Proc. Natl. Acad. Sci. U.S.A., 98
(8), 4478
–4485
(2001). https://doi.org/10.1073/pnas.071052598 0027-8424 Google Scholar
M. Takahashi,
T. Ishida,
O. Traub,
M. A. Corson, and
B. C. Berk,
“Mechanotransduction in endothelial cells: temporal signaling events in response to shear stress,”
J. Vasc. Res., 34 212
–219
(1997). 1018-1172 Google Scholar
T. Seki,
J. H. Yun, and
S. P. Oh,
“Arterial endothelium-specific activin receptor-like kinase 1 expression suggests its role in arterialization and vascular remodeling,”
Circ. Res., 93
(7), 682
–689
(2003). 0009-7330 Google Scholar
B. Hogers,
M. C. DeRuiter,
A. C. GittenbergerdeGroot, and
R. E. Poelmam,
“Unilateral vitelline vein ligation alters intracardiac blood flow patterns and morphogenesis in the chick embryo,”
Circ. Res., 80 473
–481
(1997). 0009-7330 Google Scholar
N. Hu,
D. Sedmera,
J. Yost, and
E. B. Clark,
“Structure and function of the developing zebrafish heart,”
Anat. Rec., 260 148
–157
(2000). 0003-276X Google Scholar
C. L. Feldman,
O. J. Ilegbusi,
Z. Hu,
R. Nesto,
S. Waxman, and
P. H. Stone,
“Determination of in vivo velocity and endothelial shear stress patterns with phasic flow in human coronary arteries: a methodology to predict progression of coronary atherosclerosis,”
Am. Heart J., 143
(6), 931
–939
(2002). 0002-8703 Google Scholar
S. M. Wasserman and
J. N. Topper,
“Adaptation of the endothelium to fluid flow: in vitro analyses of gene expression and in vivo implications,”
Vasc. Med., 9
(1), 35
–45
(2004). 1358-863X Google Scholar
D. Y. R. Stainier,
B. Fouquet,
J. N. Chen,
K. S. Warren, B. M. Weinstein, S. E. Meiler,
M. A. Mohideen,
S. C. Neuhauss,
L. Solnica-Krezel,
A. F. Schier,
F. Zwartkruis,
D. L. Stemple,
J. Malicki,
W. Driever, and
M. C. Fishman,
“Mutations affecting the formation and function of the cardiovascular system in the zebrafish embryo,”
Development, 123 285
–292
(1996). 0950-1991 Google Scholar
H. Masuda,
K. Kawamura,
H. Nanjo,
E. Sho,
M. Komatsu, T. Sugiyama, A. Sugita,
Y. Asari,
M. Kobayashi,
T. Ebina,
N. Hoshi,
T. M. Singh,
C. Xu, and
C. K. Zarins,
“Ultrastructure of endothelial cells under flow alteration,”
Microsc. Res. Tech., 60
(1), 2
–12
(2003). 1059-910X Google Scholar
X. Trepat,
M. Grabulosa,
F. Puig,
G. N. Maksym,
D. Navajas, and
R. Farre,
“Viscoelasticity of human alveolar epithelial cells subjected to stretch,”
Am. J. Physiol. Lung Cell Mol. Physiol., 287
(5), L1025
–1034
(2004). Google Scholar
P. A. Lucchesi,
A. Sabri, and
S. Belmadani,
“Involvement of metalloproteinases 2/9 in epidermal growth factor receptor transactivation in pressure-induced myogenic tone in mouse mesenteric resistance arteries,”
Circulation, 110
(23), 3587
–3593
(2004). 0009-7322 Google Scholar
N. Alperin,
S. H. Lee,
A. Sivaramakrishnan, and
S. G. Hushek,
“Quantifying the effect of posture on intracranial physiology in humans by MRI flow studies,”
J. Magn. Reson Imaging, 22
(5), 591
–596
(2005). 1053-1807 Google Scholar
N. Hata,
T. Wada,
K. Kashima,
Y. Okada,
N. Unno,
M. Kitagawa, and
T. Chiba,
“Non-gated fetal MRI of umbilical blood flow in an acardiac twin,”
Pediatr. Radiol., 35
(8), 826
–829
(2005). 0301-0449 Google Scholar
N. Oku,
K. Kitagawa,
M. Imaizumi,
M. Takasawa,
R. Piao,
Y. Kimura,
K. Kajimoto,
M. Matsumoto,
M. Hori, and
J. Hatazawa,
“Hemodynamic influences of losartan on the brain in hypertensive patients,”
Hypertens. Res., 28
(1), 43
–49
(2005). 0916-9636 Google Scholar
J. R. Stickel and
S. R. Cherry,
“High-resolution PET detector design: modeling components of intrinsic spatial resolution,”
Phys. Med. Biol., 50 179
–195
(2005). 0031-9155 Google Scholar
M. Liebling,
A. S. Forouhar,
M. Gharib,
S. E. Fraser, and
M. E. Dickinson,
“Four-dimensional cardiac imaging in living embryos via postacquisition synchronization of nongated slice sequences,”
J. Biomed. Opt., 10
(5), 54001
–54010
(2005). 1083-3668 Google Scholar
C. E. Willert and
M. Gharib,
“Digital particle image velocimetry,”
Exp. Fluids, 10 181
–190
(1991). https://doi.org/10.1007/BF00190388 0723-4864 Google Scholar
A. A. Adamczyk and
L. Rima,
“2-Dimensional particle tracking velocimetry (PTV): Technique and image processing algorithms,”
Exp. Fluids, 6
(6), 373
–380
(1988). 0723-4864 Google Scholar
J. G. Santiago,
S. T. Wereley,
C. D. Meinhart,
D. J. Beebe, and
R. J. Adrian,
“A particle image velocimetry system for microfluidics,”
Exp. Fluids, 25 316
–319
(1998). https://doi.org/10.1007/s003480050235 0723-4864 Google Scholar
S. Devasenathipathy,
J. G. Santiago,
S. T. Wereley,
C. D. Meinhart, and
K. Takehara,
“Particle imaging techniques for microfabricated fluidic systems,”
Exp. Fluids, 34
(4), 504
–514
(2003). 0723-4864 Google Scholar
J. R. Hove,
R. W. Koster,
A. S. Forouhar,
G. Acevedo-Bolton,
S. E. Fraser, and
M. Gharib,
“Intracardiac fluid-forces are an essential epigenetic factor for embryonic cardiogenesis,”
Nature (London), 421 172
–177
(2003). https://doi.org/10.1038/nature01282 0028-0836 Google Scholar
P. Vennemann,
K. T. Kiger,
R. Lindken,
B. C. Groenendijk,
S. Stekelenburg-de Vos,
T. L. ten Hagen,
N. T. Ursem,
R. E. Poelmann,
J. Westerweel, and
B. P. Hierck,
“In vivo micro particle image velocimetry measurements of blood-plasma in the embryonic avian heart,”
J. Biomech., 39 1191
–1200
(2006). https://doi.org/10.1016/j.jbiomech.2005.03.015 0021-9290 Google Scholar
F. Pereira and
M. Gharib,
“Defocusing digital particle image velocimetry and the three-dimensional characterization of two-phase flows,”
Meas. Sci. Technol., 13 683
–694
(2002). https://doi.org/10.1088/0957-0233/13/5/305 0957-0233 Google Scholar
S. Inoué and
K. R. Spring, Video Microscopy: the Fundamentals, 2nd ed.Plenum Press, New York (1997). Google Scholar
F. Pereira,
J. Lu,
E. C. Graff, and
M. Gharib,
“Microscale 3D flow mapping with ,”
Exp. Fluids, 42 589
–599
(2007). 0723-4864 Google Scholar
F. Pereira,
H. Stüer,
E. C. Graff, and
M. Gharib,
“Two-frame 3D particle tracking,”
Meas. Sci. Technol., 17 1680
–1692
(2006). 0957-0233 Google Scholar
A. S. Forouhar,
M. Liebling,
A. Hickerson,
A. Nasiraei-Moghaddam,
H. Tsai,
J. R. Hove,
S. E. Fraser,
M. E. Dickinson, and
M. Gharib,
“The embryonic vertebrate heart tube is a dynamic suction pump,”
Science, 312 751
–753
(2006). https://doi.org/10.1126/science.1123775 0036-8075 Google Scholar
|


