
|
|
1.IntroductionIntrinsic optical signals have the potential to revolutionize the way neuroscientists record and image neuronal function, but low signal-to-noise ratios (SNR) currently limit their usefulness. Neural activation initiates both fast and slow optical changes. Cellular swelling and molecular conformational changes elicit rapid changes in light scattering and birefringence concomitant with membrane depolarization.1, 2, 3 Neural activity also increases metabolism and elicits slower cascades of hemodynamic events that can be monitored through light absorption by oxy- and deoxy-hemoglobin. Investigators have noninvasively monitored changes in blood flow and the oxy-/deoxy-hemoglobin ratio using near-infrared spectroscopy and diffuse optical tomography (for review, see Refs. 4, 5). In vitro studies have shown that scattering and birefringence signals result from a combination of mechanisms, including changes in refractive index, protein conformation, and other processes associated with changes in membrane potential.6 Several studies support cellular swelling as the primary mechanism underlying the scattered light change,7, 8, 9 and some studies also point to swelling as a contributor to the birefringence signal.10 These changes might also be detected with near-infrared light in adult humans.11, 12, 13 However, the small SNR hinders their advancement as a functional imaging modality. A better understanding of noise sources can help us improve optical recordings and make them more practical with fewer averages. Some noise components are common to all optical neural recording systems. A detailed discussion of electrical and optical noise sources can be found in Refs. 14, 15. Briefly, light sources, photodiodes, and amplifiers introduce several types of noise, including Johnson (thermal) noise and shot noise. Shot noise, a white noise source caused by quantum fluctuation of emitted and detected photons, dominates at low intensities. Both Johnson noise and shot noise are independent of frequency. Pink noise, or noise, occurs naturally in biological systems and as electronic flicker noise. Due to the inverse relation, noise dominates the low frequencies but is overshadowed by white noise sources above a cornerstone frequency characteristic of the system. The generation and recombination of electrons within semiconductor-based photon detectors also introduce noise. Illumination noise sources represent some of the most difficult issues to address. While variations in light intensity due to mechanisms such as arc wander and power supply fluctuations can be accounted for by direct detection of the output light with a reference photodiode, other illumination noise sources, such as shot noise, are much more difficult to control. Speckle noise from coherent laser diode (LD) and partially-coherent superluminescent diode (SLD) sources may contribute to the system noise as random interference patterns across the edge of the detector. While speckle noise has long been known to be a problem in microscopy and imaging, it remains a problem and contributes to noise in optical recordings.16, 17, 18 Since speckle interference patterns from coherent light sources such as lasers are extremely bright, slight movements that cause the speckle to cross the boundary of a detector will fluctuate the optical signal significantly. In fact, several groups use speckle to image changes in cerebral blood flow.19 The presence of living tissue in an optical system also introduces noise through physiological activity on molecular, cellular, and whole-organism scales. Respiratory, cardiac, and vascular oscillations, along with other skeletal muscle activity, contribute to optical noise in multiple frequency ranges. Although instrument noise is generally considered to be lower than contributions of physiological noise sources (i.e., circulation and respiration), both physiological and instrument noise sources are still significantly larger than the fast optical signals to be recorded in vivo that directly correspond to electrical events, especially for single-pass measurements. Few studies have systematically characterized the sources of signal noise in light source/detection instrumentation, and such measurements could influence the methods used to detect fast intrinsic optical changes in vivo. Thus, the purpose of these experiments was to systematically compare the noise profiles of LDs, SLDs, and light-emitting diodes (LEDs) in two neural recording paradigms. These studies also provide a procedure to assess the number of averages required to adequately record optical signals. 2.Methods2.1.Light SourcesWe compared three light sources (LED, SLD, and LD) in vitro and two sources (LED, LD) in vivo. The LED ( , rated at or , B5b-436-30, Roithner Lasertechnik GmbH, Vienna, Austria) and SLD ( , , Superlum Diodes Ltd., Moscow, Russia) were operated in free space. The LD ( , , D660-5, US-Lasers, Inc., Baldwin Park, California) was coupled to a -diameter fiber optic. The LD and SLD were temperature-regulated by feedback-controlled thermoelectric coolers. The LED and LD were driven with batteries at a constant voltage, and the SLD was powered with a current-regulated power supply (Superlum Pilot 4, Superlum Diodes Ltd., Moscow, Russia). While current-regulated supplies are generally preferred for both LEDs and LDs due to very slow temperature and drift effects, we found no difference between the two methods in our root mean square (RMS) noise levels. 2.2.In Vitro: Crustacean NerveWe extracted nerves from the first two most rostral walking legs of lobsters (Homarus americanus) using the Furusawa “pulling out” method20 and tied the ends with silk sutures to prevent axoplasmic leakage. Our invertebrate recording technique was reported earlier.21 Briefly, we placed each isolated nerve in a recording chamber flooded with marine crustacean solution (in mM: 525 NaCl, 13.3 KCl, 12.4 , 24.8 , 5.0 dextrose, to pH 7.0 with ). The chamber featured a central, rectangular well with four smaller wells on either side. Each well was fitted with a silver electrode and isolated with petroleum jelly. A set of electrodes on one side of the imaging window delivered current pulse stimuli [STIM in Fig. 1a ], and a second set of electrodes (EP) recorded the electrical response after the population action potentials passed through the center optical well. The bottom of the central well contained a narrow slit covered with a microscope slide through which the light was transmitted during optical recordings. Light from an LED, SLD, or LD light source [LS in Fig. 1a] passed through a polarizer (POL1; for LED and LD: VIS , Linos Photonics, Milford, Massachusetts; for SLD: Polarcor 05P109AR.16, Newport Corp., Irvine, California) oriented at with respect to the long axis of the nerve bundle. Transmitted light passed through a second polarizer (POL2) crossed with respect to the first. The birefringent light intensity was recorded with a photodiode (PD) positioned over the second polarizer. The apparatus was constructed on an antivibration floating table (Minus K, Inglewood, California) to minimize mechanical noise contributions. During neural tissue measurements, all light sources were driven to produce an initial output power between 1 and . Fig. 1Schematics of (a) in vitro, and (b) in vivo optical recording paradigms. For the in vitro paradigm (a), we stimulated lobster nerves with short-current pulses (STIM), and the resulting field potential was recorded on the other side of the window (EP). Light from an LED, SLD, or LD (LS) was transmitted through the recording chamber between crossed polarizers (POL1, POL2). The transmitted intensity was recorded with a photodiode (PD). For the in vivo paradigm (b), epidural electrodes (LEEG, MEEG) recorded the electrical evoked responses after whisker twitch stimuli; an LED or LD (LS), and a photodiode (PD) implanted over the barrel cortex, recorded the optical responses.  Each nerve was stimulated with current pulses at random intervals between one and two seconds ( average stimulation rate) using a direct current isolated stimulator (Model A365R, World Precision Instruments, Inc., Sarasota, Florida). Electrical responses were recorded with a differential amplifier (Linear Technology LT1167) and filtered between and , with x1000 gain. Optical signals were filtered , amplified with a gain, and digitized simultaneously with the electrical signals at per channel. We averaged data across 1000 stimuli using three nerves for each light source. 2.3.In Vivo: Rat Barrel CortexSprague-Dawley and Long-Evans female rats ( , Taconic, ) were anesthetized with ketamine and xylazine and placed in a stereotaxic frame. All animal procedures were approved by the Washington State University Animal Care and Use Committee. We continuously monitored electrocardiogram signals from subcutaneous pin electrodes. Stainless steel screw electroencephalogram (EEG) electrodes entered holes drilled posterior to bregma [B in Fig. 1b], medial (MEEG), and lateral (LEEG) of the right temporal ridge (TR). The EEG ground reference hole (GND) was drilled caudal to lambda and to the right of the midline. The photodiode was coupled to a -diameter, -long piece of plastic fiber optic. The free end of the photodiode fiber was inserted into a -diameter hole (PD) positioned caudal to bregma medial to the right temporal ridge, applying light pressure to the dura to reduce the cardiac artifact. LED and LD illumination were directed into another -diameter hole (LS) placed caudal of the photodiode hole. The dura was left intact beneath all holes. We twitched a group of whiskers (C0, C1, C2, D0, and D1) on the side contralateral to the EEG and optical detectors with a burst (5 twitches at ) of , upward deflections. Stimuli, auditory controls, and sham controls were randomly interleaved at intervals. Optical (AC photodiode , DC photodiode ), LEEG, MEEG, and EKG signals were filtered and digitized at . We averaged across 200 stimuli (plus equal numbers of auditory and sham trials) with LED and LD light sources, then euthanized the rat with a lethal dose of sodium pentabarbitol. We filtered the cardiac arfifact offline by finding the average optical response per heart beat and subtracting the average cardiac waveform from the optical data at every cardiac trigger point in the data set.12, 22 2.4.Instrument Noise MeasurementWe assessed the noise contributions from the light sources and photodiodes by illuminating the photodiode with each light source (LED, LD, and SLD) in turn, and calculating the RMS of signals collected at for , varying the intensity of the light sources in steps. We plotted the RMS [Eq. 1] noise at each intensity against the radiant flux through the photodiode ( , UDT-555UV/LN, UDT Sensors, Hawthorne, California). For a collection of samples , Noise contributions from the photodiode and amplifier were calculated to be , which included photodiode dark current noise, amplifier input noise, and Johnson noise in the resistors. Table 1 outlines the contributions of the photodiode, amplifiers, and resistors for a bandwidth; the complete photodiode/amplifier circuit is described in Ref. 21. Since these noises are uncorrelated, their contributions add in quadrature to form the total instrument noise. Thus, we expect the measured RMS of the dark signal noise to fall close to the anticipated value, , calculated from the component specifications. Table 1Noise contributions of the photodiode dark current, the integrated op-amp input noise, the free op-amp input noise, and Johnson noise from the feedback resistors. The addition of the noises in quadrature predicts the total instrument noise, 5.67μV . After instrument noise, the RMS noise contributions of illumination and physiological sources are tabulated in vitro (lobster) and in vivo (rat) and compared to the peak amplitudes of the stimulus-evoked optical changes. The standard errors for these measurements are large due to the variability of signal strength and illumination intensity from trial to trial, but values give the reader a general idea of each source’s noise generation.
The photodiode readings were calibrated and compared with an optical power meter (OPM, console PM100, head S130A, Thorlabs GmbH, Karlsfeld, Germany). We correlated the amplifier output ( , volts) with radiant flux ( , watts) measured with the OPM and found the following linear fit: Radiant flux is a measure of radiant energy per unit time across the entire electromagnetic spectrum. Radiometric measures were chosen instead of photometric measures, such as luminous flux (lumens), because photometric quantities are wavelength-dependent and limited to the visible spectrum. Thus, the SLD emitted near-infrared light and could not be analyzed using photometric units.2.5.Physiological Noise AssessmentFor each experiment, in vitro and in vivo, of optical data were recorded in the absence of stimulation. We partitioned each data set into epochs, applied a second-order Butterworth filter from , and subsampled down from . A fast Fourier transform (FFT) of the data was used to assess the frequency characteristics of slow physiological noise sources. The FFTs were compared across light sources, and in living and dead tissue. 2.6.Stimulus-Evoked SNRFor both in vitro and in vivo paradigms, we compared the RMS noise and SNRs [Eq. 4] of the optical signal across light sources: andwhere is the RMS noise from the optical recording. Because RMS deviation is proportional to the inverse square root of the number of trials , we expected that the SNR would grow proportionally with , assuming a constant signal amplitude . Unfortunately, due to degradation of the lobster nerve over time, the signal did not remain constant. While in vitro paradigm signals can be discerned from single-pass measurements, in vivo trials often require 10 to 100 averages for the signal amplitude to rise above the noise. Thus, for in vitro measurements, we sequentially plotted the RMS and SNR across the number of averages, but this method was inappropriate for the in vivo data in which signals were not discernible in single passes. For our in vivo data, we plotted the mean SNR across the number of averages per bin using 200 combinations of the data for each set of averages. Since cardiac pulsation contributed a large systematic noise source that could be removed, we applied the EKG filter to signals before averaging and calculating the amplitude, RMS, and SNR values.3.Results3.1.Source-Detector NoiseRMS noise increased linearly with intensity for the LED and SLD sources [Fig. 2a ]. The LD noise increased with the LED and SLD noise at low intensities, but increased sharply at to a noise level exceeding those of the LED and SLD by a factor of 5 or greater [Fig. 2a]. Fig. 2Relationship between noise (RMS) and radiant flux (RF). (a) RMS against RF for three sources: LED, SLD, and LD. The upper limits for LED, SLD, and LD RMS in the illustrated range are 0.27, 1.14, and , respectively. (b) RMS normalized to the radiant intensity. The laser’s sharp increase in RMS at reflects noise introduced as the LD transitioned from LED mode to lasing. 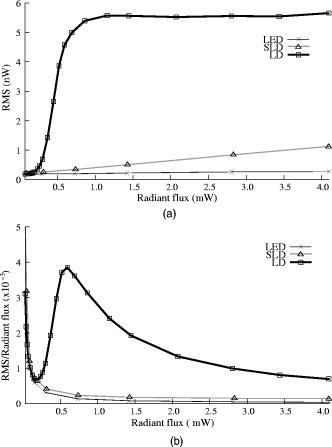 We divided RMS noise by radiant flux (RF) to account for the effects of differing intensities on RMS. Figure 2b shows the data from Fig. 2a normalized to the RF and measured using the photodiode. All three sources showed a rapid decrease in RMS/RF between 0 and . At , the LD RMS/RF increased sharply in the transition to lasing. Above of RF, the RMS/RF of all three light sources decreased [Fig. 2b]. 3.2.Instrument Dark NoiseIn the absence of light, we measured a total of RMS noise from the photodiode and amplifier (Fig. 3 ), slightly lower than the predicted value, (Table 1). Fig. 3Power spectra of optical signals in vitro from the unstimulated lobster nerves. The thick gray line (DARK) shows the spectra of the dark noise with superimposed traces showing the spectra of the LD, LED, and SLD signals transmitted through the lobster nerve. The LD, LED, and SLD signals were normalized to their DC intensities prior to FFT analysis. Note that the spectral power scale for the LD data is two orders of magnitude greater than the DARK, LED, or SLD power across all frequencies.  3.3.Physiological NoiseThe FFTs of the in vitro signals recorded in the presence of a healthy nerve yielded no significant peaks different from trials recorded with a dead nerve (data not shown). Figure 3 shows FFTs of in vitro data for the live nerve under LED, SLD, and LD illumination. Before taking the FFT, each data set was divided by the baseline intensity to control for intensity variations. The FFT data illustrates noise present, and LD noise power was two orders of magnitude greater than the SLD and LED spectra across all frequencies. Rat optical noise spectra featured peaks at and during anesthesia. These peaks were absent from data collected after the rat was euthanized (Fig. 4 ). The low-frequency power was also reduced in dead tissue. The , cardiac, and respiratory peaks in the LED FFT [Fig. 4b] were equivalent in amplitude to the LD FFT [Fig. 4a]. Fig. 4Power spectra of optical signals in vivo with an (a) LD, and (b) LED source. Both spectra feature peaks that correspond to , respiratory , and cardiac signatures . Since low-frequency components below are greater in the live rat, we assume that slow vascular oscillations (Mayer waves) may contribute to noise in this frequency range.  Table 1 shows the RMS noise contributions in the cardiac , respiratory , and slow vascular frequencies. The euthanized rat optical RMS was subtracted from the live rat optical RMS in quadrature to find physiological noise RMS in each characteristic frequency band. 3.4.In Vitro ParadigmThe illumination intensity for the laser was limited by the dynamic range of the photodiode amplifiers. LED and SLD sources were driven at maximum intensity without approaching the rails of the photodiode amplifier. Baseline measured radiant power for the transmission birefringence data was for the LD, for the SLD, and for the LED. We defined signal amplitude as the difference between the monophasic optical peak and the baseline. Signal amplitudes ranged from to (Fig. 5 ) or after 1000 averages. The optical changes were rapid ( from stimulus to peak) and short in duration . The highest amplitude optical changes occurred at the beginning of each experiment ( to or after 100 averages) and then degraded over the recording periods (1000 stimuli at random interstimulus intervals). As shown in Table 1, SNRs for single-pass measurements in lobster nerves with LED illumination were approximately 1:1. Additional filtering improved SNRs to about 10:1. More than 150 averaged trials were required to discern the birefringence signal in LD data, even after bandpass filtering. For LD lobster data, the illumination intensity was about 2 times dimmer due to the high peak-to-peak noise from the LD. Since the eventual size of the signal appeared to depend on the illumination intensity, raw signals measured with the LD were lower. However, after dividing the absolute signal size by illumination intensity, the values were comparable between LED and LD sources (Fig. 5). Fig. 5In vitro optical data for LED, SLD, and LD from stimulated lobster nerves. Black traces show the optical signals , and gray traces show the stimulus-evoked field potential. The vertical line indicates the time of stimulus. Each trace represents the average of 1000 trials. 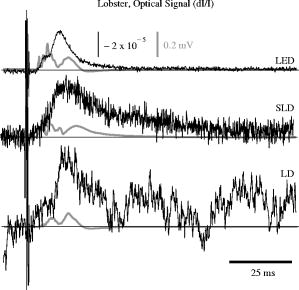 Figure 6a shows the mean and standard error of RMS noise calculated for each source across 1000 averages. RMS fell steeply in the first 100 averages, and then continued to decrease gradually from 200 to 1000 averages. RMS levels were greatest for LD, SLD, and LED data, respectively [Fig. 6a]; these differences were further exaggerated when the RMS levels were normalized to the intensity of each source [Fig. 6b]. Figure 7 compares the mean SNR for optical signals collected with the three sources across 1000 averages. The LED average SNRs increased proportional to the square root of the number of averages, peaked near 150 averages, and then gradually decreased with the degradation of the nerve over time. The SLD data had significantly lower SNRs than the LED data, and SNRs for LD data were significantly smaller than LED or SLD SNRs across 1000 averages. The LD SNRs were highly variable in the first 200 trials because the signal was significantly below the noise for the LD light source. Fig. 6RMS noise and RMS/RF across averages in vitro from the stimulated lobster nerves. (a) Mean and standard error for RMS noise in transmission birefringence signals for the LED, SLD, and LD across 1000 averages. LED RMS values were 0.62 for single-pass and 0.029 at 1000 averages. The same is shown in (b) except the RMS has been normalized to the RF of each source. LED RMS/RF values are for single-pass and at 1000 averages. Each line represents nerves. The measured baseline radiant power in vitro was for the LD, for the SLD, and for the LED. 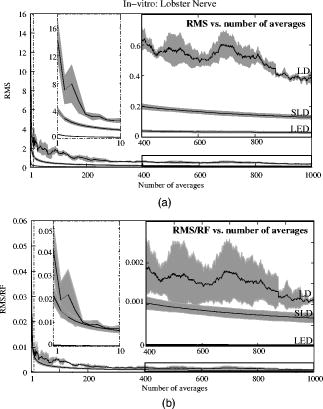 Fig. 7Mean and standard error of SNRs ( divided by RMS) of the in vitro transmission birefringence changes from the stimulated lobster nerves for three light sources across 1000 averages. Each line represents the average of nerves. The black line is the mean, and the gray background illustrates standard error. The gradual decrease of the LED SNRs after the peak at 150 averages reflects nerve degradation over time.  3.5.In Vivo ParadigmUnlike the in vitro optical data, the in vivo optical amplitude varied greatly from rat to rat depending on illumination and photodiode placement relative to the activated area (Fig. 8 ). Therefore, we chose to display separately the mean SNR data from three rats rather than the mean and standard error across the three rats to illustrate the variability in signals we observed between rats. Figure 8 displays the FFT analysis of rat optical data (no stimuli) before and after applying the cardiac filter. As has been demonstrated by others,12, 22 the cardiac filter reduces the cardiac peak at by a factor of 90. Similar to the in vitro paradigm, the LD illumination intensity was limited by the dynamic range of the amplifier, while the LED was driven to maximum intensity. The measured baseline radiant power for the rat scattered-light data was for the LD and for the LED. Fig. 8In vivo optical data during rat whisker twitches. Black traces show cardiac substracted homodynamic optical changes during and after whisker twitch stimulation (5-twitch burst at , interstimulus intervals, 200 averages). Vertical lines indicate the beginning of the burst. Data are displayed for three rats (R1, R2, and R3) with LED (left column) and LD (right column) illumination. The gray traces for rat R3 show the precardiac filtered signal (Raw), and without stimulation (No Stim). An inset FFT of the R3 data pre-(gray trace) and post-(black trace) cardiac filtering shows removal of the peak.  The optical signals featured a triphasic, hemodynamic response described in detail by several studies.23, 24 With the signal amplitude defined as the difference between the first peak at and subsequent trough at , the amplitude ranged from 0.9 to , or . The lower left waveform in Fig. 8 displays the optical data before and after cardiac subtraction. Figure 9a shows the average and standard error of RMS noise calculated across 200 averages. We divided each RMS value by the baseline light intensity to control for varied illumination intensities [Fig. 9b]. The RMS and RMS/RF for the LD were three times greater than the LED RMS or RMS/RF in single-pass trials, and LD noise continued to be significantly higher than LED noise across 200 averages. Figure 10 separately plots mean SNRs across the number of averages per bin for three rats (R1, R2, R3). In all cases, the mean SNRs obtained under LED illumination increased in fewer averages than the LD SNRs (Fig. 10). Fig. 9RMS noise across averages in vivo during rat whisker twitches. (a) Mean (black line) and standard error (gray background) for RMS noise in cardiac-subtracted homodynamic signals for the LED and LD from 1 to 200 averages. The same is shown in (b) except the RMS has been normalized to the RF of each source. Measured baseline radiant power in vivo was for the LD and for the LED.  4.DiscussionThe LED data had significantly higher SNRs in fewer averages than LD data for both the in vitro and in vivo recordings. Since instrument noise approached the signal size, it was important to reduce the noise sources as much as possible; but the biggest gains in SNR were obtained by using LEDs (Table 1). In vitro, the peak signal size was greater than the LED and photodiode noise contributions, yielding clear signals in few or no averages. The high noise of the LD necessitated slightly lower intensity illumination to stay within the dynamic range of the photodiode amplifier, and thus the signal size was smaller; however, the SNR was much smaller, requiring 100 or more averages to see the signal. Similarly, the in vivo signal size was smaller than total noise for both the LED and LD trials, but SNRs for the LED trials were higher because of lower noise. 4.1.Source-Detector NoiseAt low intensities, the RMS/RF curves for all sources looked identical, rapidly decreasing with increasing RF, which was expected because the relative contributions of shot noise and photodiode dark current decreased relative to other noise sources at higher intensities. When plotting RMS noise against radiant power, the laser’s sharp increase in RMS at reflects the noise introduced as the LD transitioned from LED mode to lasing. After the transition to lasing, the LD’s RMS remained significantly higher than the LED or SLD RMS, implicating speckle as a possible disadvantage of coherent light sources. Although speckle interference patterns were not directly characterized in these experiments, the sharp increase in RMS noise concomitant with the laser’s transition from LED mode to lasing suggests that speckle arising from self-interference of coherent light may have contributed significantly to the LD instrument noise. Additionally, our previous studies using CCD imaging technology used LEDs specifically because we observed a significant speckle pattern in the images obtained with LDs.23 Similar to the noncoherent LED, the noise profile of the semicoherent SLD increased linearly with increasing RF, indicating the absence of a transition point in this source. Above intensities dominated by shot noise, SLD RMS increased at a faster rate than LED RMS [Fig. 2a], suggesting that speckle noise also may have contributed significantly to the SLD noise profile or that this light source is less stable. The intensity-normalized FFTs of LD, SLD, and LD signals in vitro (Fig. 3) showed that the LD had a frequency power two orders of magnitude greater than the LED or SLD across all frequencies, again reflecting contributions from white noise sources such as speckle. 4.2.Physiological NoiseFor the in vitro recordings, the similarity between the live-nerve and dead-nerve FFTs suggests that any cellular-or molecular-level noise contributions fell below the sensitivity of the recording method. In vivo, two peaks present in the live-rat FFT and absent in the euthanized-rat FFT corresponded to physiological noise generators: cardiac at , and respiration at . Both the LED and LD FFTs also had power in the low frequencies corresponding to noise; however, the low-frequency density was greater in the live rats than in the euthanized rats, suggesting that other low-frequency physiological sources may have contributed to the low frequencies. For example, in vivo signals may also contain Mayer waves ( , Ref. 25), spontaneous oscillations of arterial pressure tightly coupled with the oscillations of efferent sympathetic nervous system activity (for review, see Ref. 26). However, in optical recordings, noise dominates at these low frequencies, and we attempted to separate the effects of Mayer waves from the contribution by subtracting live and dead animal recordings for frequencies between 0 and (Table 1). As LD intensity increased, so did the noise. Since the input range of the photodiode system was limited, we could only increase the laser diode intensity until the variability (perhaps due to the speckle noise) began to saturate the dynamic range of the photodiode system. Ideally, the brighter the light source, the bigger the SNR of the optical signal by overcoming shot noise limitations; however, the added noise of the LD counteracted gains over the shot noise achieved with brighter illumination. 4.3.In Vitro ParadigmSince physiological noise sources were low in vitro, higher SNRs were observed due to lower overall RMS noise. The LED SNR profile peaked at 150 averages, but then decreased over the next 850 averages because nerve health and corresponding signal amplitude decayed over time. Laser diode noise failed to increase with the square root of the number of trials like the LED and SLD SNRs, because below 200 averages, the signal size was significantly below LD noise levels, causing the SNRs in the 1 to 200 trial range to appear variable. The reduced light source noise of LEDs enabled signal recordings with higher SNRs in fewer averages, an advantage for limited-life, in vitro preparations. 4.4.In Vivo ParadigmThe high variability in the optical response amplitude across different rats likely resulted from variables such as the position of the photodiode over the whisker barrels and anesthesia depth. Like the in vitro experiments, the higher SNRs of hemodynamic signals with the LED over the LD indicate that LEDs are a better light source for noncoherent neural recording applications. In spite of the long integration times typically used to reduce speckle noise for the slow hemodynamic signals seen here, LEDs maintain a significant advantage, perhaps due to noise reduction at low frequencies. 5.ConclusionsLaser diodes are a commonly used illumination source for in vivo optical neural imaging and recording in freely moving chronic studies because of their high-intensity illumination capabilities; however, we observed that the noise introduced by LDs counteracted the benefits of high brightness when compared with low-noise LEDs. LED recordings produced roughly a 10-fold increase in SNRs in vitro (Fig. 7) and a 2- to 3-fold increase in vivo (Fig. 10) over LD recordings. These gains are significant; however, methods must be pursued to further increase the contrast between intrinsic signals and noise, making single-pass measurements more practical. Such efforts may include the development of brighter, more stable noncoherent sources, and the application of birefringence recording and imaging in vivo. Additionally, the LD intensity was limited by laser noise, with peak-to-peak fluctuations that saturated the dynamic range of the amplifiers, both in vitro and in vivo. LD SNRs could be improved by reducing the amplifier gain and powering the LD with a higher light output. This strategy effectively reduces the proportional contribution of shot noise, since it appears from Fig. 2 that speckle remains constant as LD intensity increases. However, even when the laser was driven in its optimal range, as shown at the rightmost points in Fig. 2, the LD was significantly noisier than the LED for both raw [Fig. 2a] and intensity normalized [Fig. 2b] RMS noise, possibly due to speckle. We have previously investigated methods to partially decohere the light (also discussed in Ref. 27). However, these efforts usually made speckle worse by breaking the coherent beam into more components; or the method both reduced intensity and increased complexity to the point that lasers became impractical for in vivo measurements, especially in freely moving animals, which further supports the use of LEDs. Running a coherent source through a long, multimode fiber has been a useful method for reducing speckle noise in optical coherence tomography.28 Coupling through a short, multimode fiber propagated coherent light and speckle patterns, and coupling through a single-mode fiber cut the intensity to the point that made in vivo recording impractical. Once the coherent light from the single-mode fiber interacted with tissue, the interference patterns began to appear again. Since light is diffuse in tissue due to scattering, a large single-channel detector with a or greater diameter might prevent speckle patterns from crossing the edge of the detector and prevent aperture effects. We used a large-area detector for the lobster experiments, but this would be impractical for in vivo, freely moving animal studies. Additionally, speckle interference patterns vary both laterally and axially in tissue with respect to the detector. Using a large single-channel detector could reduce the consequences of the detection aperture in and , but not in . Thus, the most effective way to rid signals of speckle noise in scattering tissue is to illuminate with noncoherent light. Independent of detection aperture effects, the constructive interference of coherent light produces bright spots that can saturate points in the middle of the detector, resulting in an output that does not accurately reflect the average intensity across the detector. Thus, when these saturating speckles move around the detector, the output still fluctuates greatly, because the photodetector does not accurately measure the total light intensity across the area. If a tightly focused beam of coherent light is not required for an optical measurement (i.e., near-infrared diffuse optical tomography and scattered light imaging), noncoherent light is preferable because coherent light speckle may introduce excessive noise. Since low-coherence SLDs offer a bright and narrow beam alternative to highly coherent LDs, we included this light source in our analysis. Mercury, xenon, and mercury-xenon arc lamps are commonly used for fluorescence-and voltage-sensitive dye applications in microscopy.15 However, for this study we selected LEDs over halogen light for a noncoherent source for in vivo measurements because LEDs are more convenient, just as bright at narrow wavelengths,29 and more stable at low frequencies30 than halogen sources. Some studies have also shown that LEDs have advantages over halogen sources for intrinsic and voltage-sensitive dye recordings.31, 32 LED technology improves each year and has created low-power, efficient devices that may eventually exceed the intensities possible by halogen and arc lamp sources for narrow wavelengths. While lasers have been practical for detecting slow hemodynamic changes (see Refs. 4, 5), low-noise sources such as LEDs are critical in advancing toward single-pass measurements of rapid intrinsic optical signals in vivo. For the measurement of slow hemodynamic changes, long integration times may average out the speckle noise generated in coherent laser beams. However, in measurements of rapid signals with short integration times ( or faster), the speckle noise may swallow the small, transient changes or even the more robust hemodynamic changes recorded in single passes. A close look at recent literature shows many systems use laser diodes for in vivo chronic measurements of hemodynamic changes. Currently available commercial devices also use laser diodes (e.g., Hamamatsu NIRO-200, Hitachi ETG-4000). Several investigators use halogen sources33, 34, 35 for fixed imaging of acute preparations, or restrained preparations with windows. Only recently have some investigators published work with LEDs (e.g., Refs. 24, 36). Recent studies utilizing LEDs in vivo have achieved some of the most robust signals ever observed, presumably due to the advantages of LEDs highlighted by the present study and by Ref. 31. For freely moving human and animal studies (e.g., Refs. 37, 38), lasers have been popular because LDs with output powers in the range approved by the U.S. Federal Drug Administration (FDA) can be modulated at high frequencies for phase measurements. In the current study, all three light sources could produce about the same output intensity ( , Fig. 2). Indeed, there are lasers that are brighter than our LEDs; however, LEDs also share rapid modulation capabilities and are becoming as bright as class IIIb lasers in the near-infrared wavelengths, which is encouraging for in vivo work since light in this frequency range penetrates skin and skull and is scattered by neural tissue.39 For comparison purposes, we used the brightest LED available at the wavelength of our laser diode , because this wavelength was optimal for detecting the hemodynamic changes in vivo. Brighter near-infrared LEDs are currently available, and our preliminary work with these LEDs indicates that they maintain low-noise characteristics. Several factors recommend LEDs as practical, inexpensive, and low-noise alternatives to coherent sources for neural recording applications. The sharp increase in RMS noise at the lasing threshold suggests that speckle noise contributed significantly to the LD’s lower SNRs. LEDs exhibit greater, low-frequency stability than lasers and halogen sources.30, 31 We tried using both voltage and current sources to drive the LEDs and LDs, with no differences in the RMS noise levels. A current-regulated power source minimized very slow variations in intensity due to temperature and drift, but these effects were not significant in our studies. LEDs do not normally require temperature regulation, and they can be driven with low-power voltage sources, although current sources and temperature regulation may be preferred for applications that require long-term stability. Many techniques use fiber-coupled light from a variety of different sources, including halogen, xenon, and lasers for delivering photons directly to the animal. However, fiber coupling is bulky and restrictive to animal movement, especially if the animal is as small as a rat or a mouse. Additionally, movement of the fiber results in additional noise in the illumination intensity due to changing photon paths through the fiber and changes in the coupling of the fiber to the animal. In contrast, LEDs are inexpensive, easy to use, and can be easily carried by animal and human subjects. AcknowledgmentsThis research was supported by the National Institutes of Health MH60263, the Murdock Foundation, and the W.M. Keck Foundation. J. L. Schei was supported by the Poncin Foundation. ReferencesL. B. Cohen,
R. D. Keynes, and
B. Hille,
“Light scattering and birefringence changes during nerve activation,”
Nature (London), 218
(5140), 438
–441
(1968). https://doi.org/10.1038/218438a0 0028-0836 Google Scholar
I. Tasaki,
A. Watanabe,
R. Sandlin, and
L. Carnay,
“Changes in fluorescence, turbidity, and birefringence associated with nerve excitation,”
Proc. Natl. Acad. Sci. U.S.A., 61
(3), 883
–888
(1968). https://doi.org/10.1073/pnas.61.3.883 0027-8424 Google Scholar
D. M. Rector,
K. M. Carter,
P. L. Volegov, and
J. S. George,
“Spatio-temporal mapping of rat whisker barrels with fast scattered light signals,”
Neuroimage, 26
(2), 619
–627
(2005). 1053-8119 Google Scholar
A. Villringer and
B. Chance,
“Non-invasive optical spectroscopy and imaging of human brain function,”
Trends Neurosci., 20
(10), 435
–442
(1997). https://doi.org/10.1016/S0166-2236(97)01132-6 0166-2236 Google Scholar
D. A. Boas,
M. A. Franceschini,
A. K. Dunn, and
G. Strangman,
“Noninvasive imaging of cerebral activation with diffuse optical tomography,”
In Vivo Optical Imaging of Brain Function, 193
–221 CRC Press, Boca Raton, Florida
(2002). Google Scholar
A. J. Foust and
D. M. Rector,
“Optically teasing apart neural swelling and depolarization,”
Neuroscience, 145
(3), 887
–899
(2007). https://doi.org/10.1016/j.neuroscience.2006.12.068 0306-4522 Google Scholar
L. B. Cohen,
“Changes in neuron structure during action potential propagation and synaptic transmission,”
Physiol. Rev., 53 373
–418
(1973). 0031-9333 Google Scholar
I. Tasaki and
P. M. Byrne,
“Rapid structural changes in nerve fibers evoked by electrical current pulses,”
Biochem. Biophys. Res. Commun., 188 559
–564
(1992). https://doi.org/10.1016/0006-291X(92)91092-5 0006-291X Google Scholar
X. C. Yao,
D. M. Rector, and
J. S. George,
“Optical lever recording of displacements from activated lobster nerve bundles and Nitella internodes,”
Appl. Opt., 42 2972
–2978
(2003). 0003-6935 Google Scholar
X. C. Yao,
A. Foust,
D. M. Rector,
B. Barrowes, and
J. S. George,
“Cross-polarized reflected light measurement of fast optical responses associated with neural activation,”
Biophys. J., 88 4170
–4177
(2005). https://doi.org/10.1529/biophysj.104.052506 0006-3495 Google Scholar
J. Steinbrink,
M. Kohl,
H. Obrig,
G. Curio,
F. Syre,
F. Thomas,
H. Wabnitz,
H. Rinneberg, and
A. Villringer,
“Somatosensory evoked fast optical intensity changes detected non-invasively in the adult human head,”
Neurosci. Lett., 291
(2), 105
–108
(2000). https://doi.org/10.1016/S0304-3940(00)01395-1 0304-3940 Google Scholar
M. A. Franceschini and
D. A. Boas,
“Noninvasive measurement of neuronal activity with near-infrared optical imaging,”
Neuroimage, 21
(1), 372
–386
(2004). 1053-8119 Google Scholar
E. L. Maclin,
K. A. Low,
J. Sable,
M. Fabiani, and
G. Gratton,
“The event-related optical signal to electrical stimulation of the median nerve,”
Neuroimage, 21
(4), 1798
–1804
(2004). 1053-8119 Google Scholar
P. Horowitz and
W. Hill, The Art of Electronics, Second Ed., 428
–455 Cambridge University Press, Cambridge, Massachusetts
(1989). Google Scholar
M. Zochowski,
M. Wachowiak,
C. X. Falk,
L. B. Cohen,
Y.-W. Lam,
S. Antic, and
D. Zecevic,
“Imaging membrane potential with voltage-sensitive dyes,”
Biol. Bull., 198
(1), 1
–21
(2000). 0006-3185 Google Scholar
J. D. Rigden and
E. I. Gordon,
“The granularity of scattered optical maser light,”
Proc. IRE, 50 2367
–2368
(1962). 0096-8390 Google Scholar
P. S. Considine,
“Effects of coherence on imaging systems,”
J. Opt. Soc. Am., 56 1001
–1009
(1966). 0030-3941 Google Scholar
J. M. Schmitt,
S. H. Xiang, and
K. M. Yung,
“Speckle in optical coherence tomography,”
J. Biomed. Opt., 4 95
–105
(1999). https://doi.org/10.1117/1.429925 1083-3668 Google Scholar
A. K. Dunn,
H. Bolay,
M. A. Moskowitz, and
D. A. Boas,
“Dynamic imaging of cerebral blood flow using laser speckle,”
J. Cereb. Blood Flow Metab., 21
(3), 195
–201
(2001). https://doi.org/10.1097/00004647-200103000-00002 0271-678X Google Scholar
K. Furusawa,
“The depolarization of crustacean nerve by stimulation or oxygen want,”
J. Physiol. (London), 67
(4), 325
–342
(1929). 0022-3751 Google Scholar
K. M. Carter,
J. S. George, and
D. M. Rector,
“Simultaneous birefringence and scattered light measurements reveal anatomical features in isolated crustancean nerve,”
J. Neurosci. Methods, 135
(1–2), 9
–16
(2004). https://doi.org/10.1016/j.jneumeth.2003.11.010 0165-0270 Google Scholar
G. Gratton and
P. M. Corballis,
“Removing the heart from the brain: Compensation for the pulse artifact in the photon migration signal,”
Psychophysiology, 32
(3), 292
–299
(1995). https://doi.org/10.1111/j.1469-8986.1995.tb02958.x 0048-5772 Google Scholar
D. M. Rector,
R. F. Rogers,
J. S. Schwaber,
R. M. Harper, and
J. S. George,
“Scattered-light imaging in vivo tracks fast and slow processes of neurophysiological activation,”
Neuroimage, 14
(5), 977
–994
(2001). 1053-8119 Google Scholar
C. H. Chen-Bee,
T. Agoncillo,
Y. Xiong, and
R. D. Frostig,
“The triphasic intrinsic signal: implications for functional imaging,”
J. Neurosci., 27
(17), 4572
–4586
(2007). https://doi.org/10.1523/JNEUROSCI.0326-07.2007 0270-6474 Google Scholar
J. E. Mayhew,
S. Askew,
Y. Zheng,
J. Porrill,
G. W. M. Westby,
P. Redgrave,
D. M. Rector, and
R. M. Harper,
“Cerebral vasomotion: a oscillation in reflected light imaging of neural activity,”
Neuroimage, 4
(3), 183
–193
(1996). 1053-8119 Google Scholar
C. Julien,
“The enigma of Mayer waves: facts and models,”
Cardiovasc. Res., 70 12
–21
(2006). 0008-6363 Google Scholar
T. S. McKechnie,
“Speckle reduction,”
Laser Speckle and Related Phenomena, 4 123
–170 Springer-Verlag, Heidelberg, Germany
(1984). Google Scholar
E. Kim,
S. Oh,
J. Oh, and
T. E. Milner,
“Optical coherence tomography speckle reduction by a partially spatially coherent source,”
J. Biomed. Opt., 10 064034-1
–064034-9
(2005). https://doi.org/10.1117/1.2138031 1083-3668 Google Scholar
A. J. Foust,
R. M. Beiu, and
D. M. Rector,
“Optimized birefringence changes during isolated nerve activation,”
Appl. Opt., 44
(11), 2008
–2012
(2005). https://doi.org/10.1364/AO.44.002008 0003-6935 Google Scholar
S. L. Rumyantsev,
M. S. Shur,
Y. Bilenko,
P. V. Kosterin, and
B. M. Salzberg,
“Low frequency noise and long-term stability of noncoherent light sources,”
J. Appl. Phys., 96 966
–969
(2004). https://doi.org/10.1063/1.1763225 0021-8979 Google Scholar
B. M. Salzberg,
P. V. Kosterin,
M. Muschol,
A. L. Obaid,
S. L. Rumyantsev,
Y. Bilenko, and
M. S. Shur,
“An ultra-stable non-coherent light source for optical measurements in neuroscience and cell physiology,”
J. Neurosci. Methods, 141
(1), 165
–169
(2005). https://doi.org/10.1016/j.jneumeth.2004.06.009 0165-0270 Google Scholar
M. Nishimura,
H. Shirasawa, and
W.-J. Song,
“A light-emitting diode light source for imaging of neural activities with voltage-sensitive dyes,”
Neurosci. Res. (N Y), 54
(3), 230
–234
(2006). 0077-7846 Google Scholar
E. Shtoyerman,
A. Arieli,
H. Slovin,
I. Vanzetta, and
A. Grinvald,
“Long-term optical imaging and spectroscopy reveal mechanisms underlying the intrinsic signal and stability of cortical mats in V1 of behaving monkeys,”
J. Neurosci., 20
(21), 8111
–8121
(2000). 0270-6474 Google Scholar
B. A. Brett-Green,
C. H. Chen-Bee, and
R. D. Frostig,
“Comparing the functional representations of central and border whiskers in rat primary somatosensory cortex,”
J. Neurosci., 21
(24), 9944
–9954
(2001). 0270-6474 Google Scholar
A. W. Roe,
“Long-term optical imaging of intrinsic signal in anesthetized and awake monkeys,”
Appl. Opt., 46
(10), 1872
–1880
(2007). https://doi.org/10.1364/AO.46.001872 0003-6935 Google Scholar
B. W. Zeff,
B. R. White,
H. Dehghani,
B. L. Schlaggar, and
J. P. Culver,
“Retinotopic mapping of adult human visual cortex with high-density diffuse optical tomography,”
Proc. Natl. Acad. Sci. U.S.A., 104
(29), 12169
–12174
(2007). https://doi.org/10.1073/pnas.0611266104 0027-8424 Google Scholar
B. Chance,
M. Cope,
E. Gratton,
N. Ramanujam, and
B. Tromberg,
“Phase measurement of light absorption and scatter in human tissue,”
Rev. Sci. Instrum., 69 3457
–3481
(1998). https://doi.org/10.1063/1.1149123 0034-6748 Google Scholar
G. Gratton and
M. Fabiani,
“The event-related optical signal (EROS) in visual cortex: replicability, consistency, localization, and resolution,”
Psychophysiology, 40
(4), 561
–571
(2003). https://doi.org/10.1111/1469-8986.00058 0048-5772 Google Scholar
H. R. Eggert and
V. Blazek,
“Optical properties of human brain tissue, meninges, and brain tumors in the spectral range of ,”
Neurosurgery, 21
(4), 459
–464
(1987). 0148-396X Google Scholar
|
||||||||||||||||||||||||||||||||||||||||||||||||||||||||||||||||||||||||||||||||||||||||||


