
|
|
1.IntroductionThere are increasing opportunities and needs to deliver therapy directly to the brain. For example, both the public and scientific communities have voiced strong interest in developing stem cell replacement and gene therapy to treat neurological disorders such as Alzheimer’s, Parkinson’s, and Lou Gehrig’s diseases. An example of a therapy that has just been approved recently for the treatment of Parkinson’s disease is deep brain stimulation1, 2 (DBS). In the DBS procedure, an electrode is placed in certain small nuclei deep in the brain and chronic intermittent electrical stimulation is applied.3 DBS has been heralded as one of the most important advances in the management of Parkinson’s disease since the discovery of L-DOPA therapy. A theme common to both DBS and other emerging therapeutic interventions is the need for more precise and safer methods for positioning probes and catheters in the brain. Misplacement of the electrode by even millimeters in the region of the brain involved with these procedures can make a significant difference in the clinical outcome. Standard stereotactic procedures are currently employed whereby a probe is guided through a small opening in the skull to a coordinate determined by a preoperative magnetic resonance imaging (MRI) or computed tomography (CT) scan. These are essentially blind procedures because the surgeon is unable to visualize the target directly. The surgeon cannot know whether a blood vessel is at risk of becoming lacerated as the probe advances or whether the brain has shifted due to leakage of cerebrospinal fluid. Intraoperative MRI to serve as guidance system is not currently feasible due to space constraints of the MRI gantry and the need to convert all surgical instruments to nonmagnetic materials. The challenge of translational research is to identify unmet clinical needs and to match them with appropriate emerging technology. Success depends on understanding both the strengths and limitations of the technology. Catheter-based optical coherence tomography (OCT) is a form of OCT based on imaging probes inserted into a body lumen or directly into a soft tissue through thin catheters.4, 5 Catheter-based OCT has been developed primarily for gastrointestinal and intravascular imaging. The strengths of catheter-based OCT include its high spatial resolution, real-time imaging capability, and a geometry that is well suited for minimally invasive interventions. Its limitations are its relatively small field of view and low optical contrast in most biological tissues. Therefore, ideal applications for catheter-based OCT will involve imaging structures with high intrinsic optical contrast located close to the imaging probe. Optical guidance of stereotactic procedures such as DBS takes advantage of the unique strengths of catheter-based OCT and circumvents its limitations. Another unmet need in the neuroscience field is a more rapid and simpler means to identify transmissible spongiform encephalopathy (TSE). TSEs are a group of fatal transmissible diseases that include bovine spongiform encephalopathy (BSE) or Mad Cow disease in cattle, scrapie in sheep, chronic wasting disease in deer, and Creutzfeldt-Jakob disease (CJD) in humans, and its variant, vCJD, caused by infection of humans by Mad Cow disease. A prevailing, although as yet unproven, hypothesis is that these diseases are caused by the self-propagating conversion of the normal host prion protein to an amyloidotic form.6 An alternate hypothesis is that prion protein amyloidosis is associated with, but not the source of, the infection.7 Regardless of their etiology, the histopathological hallmark of these disorders is the development of widespread vacuoles in the brain, i.e., spongiosis.8 These vacuoles are predominantly 5 to in diameter, but can be as large as in diameter. The smooth surfaces of the vacuoles provide highly reflective interfaces that can be detected by OCT. Biochemical assays exist for detecting prion amyloid, but their complexity, cost, and lack of immediacy make them suboptimal for screening the tens of millions of livestock that enter the food chain each year. Although a relatively rare disorder of humans, CJD must be ruled out by the physician each time a patient presents with a history of rapid-onset dementia. Variant CJD may be much more prevalent in the United Kingdom and other locations where exposure to Mad Cow disease was high. A recent survey of tonsils and appendixes collected at random in the United Kingdom for the presence of the unique prion amyloid associated with vCJD put the prevalence of vCJD at incubating cases presuming 100% ascertainment.9 Two cases of transfusion-transmitted vCJD have now also been recognized. Currently, the definitive diagnostic test for CJD or vCJD is brain biopsy, to obtain tissue for histology and biochemical assay. Although OCT has been widely used to image structures such as the retina and skin, there have only been a few reports of its use for brain imaging.10, 11, 12, 13 The reason for the lack of interest in brain imaging is not clear. One possibility could be that the early focus on imaging cortical gray matter was not well suited for OCT because of its lack of high-contrast structures. The use of fixatives in some of these studies is likely to have decreased imaging depth and further degraded optical contrast and image quality. The study presented here was carried out with the specific intent of examining structures in brain tissue with high intrinsic optical contrast. Catheter-based OCT imaging of brain tissue has also not been previously reported. This study was also carried out to test the possibility that catheter-based OCT is suitable for guiding stereotactic procedures in the brain and minimally invasive diagnostic procedures. 2.MethodsFigure 1(a) is a block diagram of the prototype OCT system, built by LightLab Imaging (Westford, Massachusetts) for neuroimaging research. The system consists of an imaging engine, probe/patient interface unit (PIU), rotary OCT probe, computer, and display. Connected to the computer via serial interface, the imaging engine houses the light source and other key electro-optical components. Light from the broadband light source is split into reference and sample beams by an efficient polarization-diversity interferometer. The broadband light source consists of a pair of superluminescent diodes (SLDs) with different central wavelengths whose outputs were combined to produce 18 mW of polarized single-mode light at a peak wavelength of 1300 nm, with a FWHM bandwidth of 65 nm. Determined by the FWHM width of the coherence function measured in air, the axial resolution of the OCT system in tissue is approximately . Light from red laser diode is colaunched with the near-IR beam through a wavelength-division multiplexer to enable visualization of the beam at the distal end of the OCT probe. To form a circumferential image, a motor-driven rotary coupler within the PIU rotates the optical fiber inside the imaging core. The PIU includes a mechanism for pulling the rotating fiber back within the imaging catheter at a constant speed over a maximum distance of 5 cm. The sample beam transmits through the rotating fiber and focuses on the tissue. After passing back into the interferometer, the light backscattered from the tissue mixes with separate reference beams in orthogonal polarization states. The optical delay line in the reference arm, which consists of multifaceted spiral-shaped mirror rotated by an air-bearing motor, scans a distance of 4.5 mm in air (about 3.3 mm in tissue) at a user-selected repetition rate between 1000 and . Interference signals from a pair of photodetectors are processed by onboard digital-signal processors before being sent to the main computer for scan formatting and display. In this paper, images were acquired at approximately , with each frame consisting of 256 lines. Fig. 1(a) Block diagram of the prototype OCT system, built by LightLab Imaging (Westford, Massachusetts) for neuroimaging research; (b) schematic of the imaging probe employed in this study, based on a fiber optic imaging core, and (c) schematic of the micro-optical lens/beam deflector assembly at the tip of the catheter, with a representative beam profile measured at the focal point of the microlens. 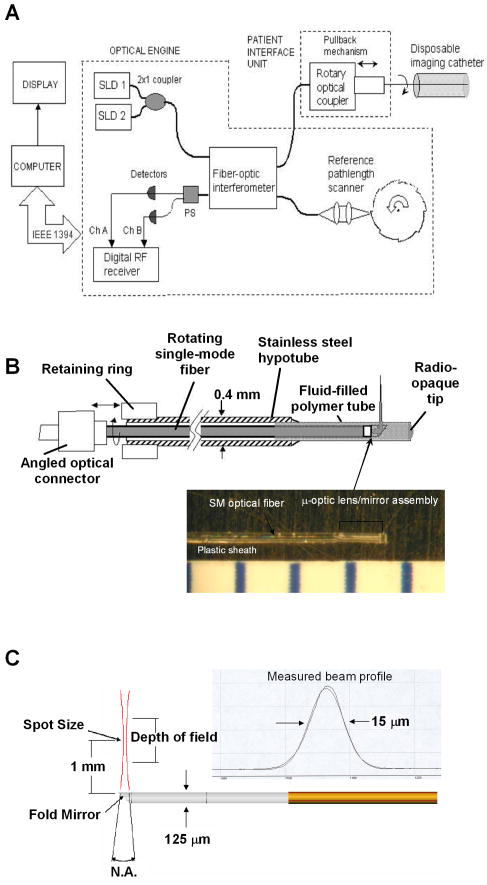 The OCT probe employed in this study was based on a fiber optic imaging core with a unique design14 [Fig. 1(b)]. Unlike rotary ultrasound probes, the OCT probe does not employ a torque cable. Instead, the fiber rotates inside a plastic sheath that contains a mixture of fluids formulated to provide viscous drag for reduction of nonuniform rotational distortion. Eliminating the torque cable simplifies fabrication of the catheter and minimizes its diameter. A micro-optical lens/beam deflector assembly at the tip of the catheter [Fig. 1(c)] consists of a segment of multimode fiber interposed between segments of coreless single-mode fiber. Composed of silica glass with a tailored refractive-index profile, the multimode fiber segment acts as a converging lens. To deflect the focused beam perpendicular to the long axis of the fiber, one end of the distal coreless segment is polished at a 45-deg angle. The lens assembly is about 1 mm long and has the same diameter as the single-mode fiber to which it is attached. Because the elements of the lens assembly are fusion-spliced via arc welds, its mechanical strength is similar to that of an untreated fiber. For this study, the microlens assembly was configured to provide a focal spot diameter of (FWHM) at a working distance of approximately 1 mm from the center of the probe. The outer diameter of the probe that was inserted in the brain was 0.36 mm, small enough to insert through 24-gauge thin-wall stainless tubing. For the studies on optical guidance in DBS, unfixed coronal brain sections containing the basal ganglia were obtained either from the medical examiner’s office or from the University of Maryland Brain and Tissue Bank for Developmental Disorders. Brain tissue was typically obtained between 12 and 14 h following death and sectioned into 10-mm coronal slices. Sections from the Brain Bank were rapidly frozen in isopentane/dry ice and then stored at . The brain tissue was allowed to thaw slowly in chilled buffer solution (25 to 35 min). An example of a brain slice through the putamen and globus pallidus after thawing is shown in Fig. 2 , and an example of a slice through the subthalamic nucleus (STN) is shown in Fig. 4(b) in Sec. 3. A total of 31 sections were examined from 25 donors with ages ranging from 19 to 54. The most common cause of death was trauma. None had a history of a neurodegenerative disorder. Fig. 4OCT through the STN and substantia nigra. (a) L-mode projection of an OCT pass. The trajectory taken in this recording was probably tilted a little to the left of that shown in (b). (b) OCT probe is placed over a coronal brain section containing the thalamus, STN, and substantia nigra. Note the characteristic reddish appearance of the STN and the dark brown appearance of the substantia nigra. (c) OCT images through the STN typically show abundant fine arterioles. (d) OCT images of the substantia nigra typically show thick ribbons of white matter. Penetration of the IR light of the OCT is surprisingly good through this structure that is dark in the visible spectrum. Scale bar, 0.5 mm.  Fig. 2Actual catheter-based OCT imaging probe is placed on top of a brain section through the human putamen (PUT), globus pallidus externa (GPe), and globus pallidus interna (GPi). The tip of the probe is placed just past GPi. Its diameter is 0.36 mm. The arrows point to blood vessels that are discussed in the text.  The OCT imaging probe was placed inside a thin-walled 24-gauge hypodermic stainless-steel tube and advanced until the tip of the probe extended 1 to 2 mm past the opening tip of the tube. The hypodermic tube with the imaging probe inside was attached to a micromanipulator and advanced slowly within the brain in a track parallel to the surface of the brain section. In a few cases in which the brain was cut into thicker sections, the probe direction was selected to mimic a typical DBS track during stereotactic surgery for movement disorders. The red targeting beam emitted from the tip of the imaging probe was visible through the brain with the room lights dimmed. Visual feedback from the targeting beam helped provide independent positional information. The position of the probe identified by the operator and the positional reading of the micromanipulator were recorded on audio notes stored synchronously with the video files. The position determined by OCT was subsequently compared with the recorded position. For the detection of spongiform changes, the brain from a 53-year-old woman who died of CJD was studied. The brain was cut into 1-cm coronal sections and each section was frozen on slabs of dry ice immediately following autopsy. Storage was at . A portion of the parahippocampal gyrus of the temporal lobe was examined by OCT after slow thawing (25 to 35 min). 3.Results and DiscussionBrain tissue can be broadly divided into gray matter and white matter. Gray matter consists mainly of the cell bodies of neurons and glial cells. Gray matter constitutes the outer portion of the cortex and the bulk of the deep brain nuclei that are the targets of DBS. White matter consists of axons wrapped tightly by multiple layers of myelin, thin lipid membranes that serve as electrical insulation. White matter tracts emerge from the inner surfaces of the cortex and often form the borders of the deep brain nuclei. Optical guidance for stereotactic procedures such as DBS relies on the ability to detect optically the junctions of these two structures to use them as landmarks to the target. A cross section through one of the targets for DBS is illustrated in Fig. 2. In this photograph of an unfixed human basal ganglion, the putamen, globus pallidus externa, and globus pallidus interna can be seen. A schematic identifying the specific structures is shown in Fig. 3(d) . Note the white appearance of the fiber tracts that surround the gray matter nuclei and the striations of thin fiber bundles within the putamen. The OCT imaging probe is placed on top of the cross section in Fig. 2 to illustrate the relative dimensions of the probe and to illustrate the orientation of the track used to obtain the images shown in Fig. 3. Fig. 3Structures within the striatum can be clearly identified by OCT. (a) L-mode projection of OCT displays the absolute averaged intensity of backscattered light and depth of penetration as the probe is linearly advanced. For interpretation compare the L-mode data to actual anatomic structures shown in Figs. 2 and 3(d). (b) Individual standard OCT image of the putamen obtained during a single 360° rotation of the beam. The oval-shaped bright spots are cross sections of the white matter striations in the putamen. (c) White matter is characterized by strong backscattering and poor penetration. (d) Schematic of the OCT track through the striatum. (e) GPi has the appearance of closely packed white matter bundles separated by thin gray matter bands. Real-time video sequence illustrating this OCT trajectory can be found in Ref. 19. Scale bar, 0.5 mm. 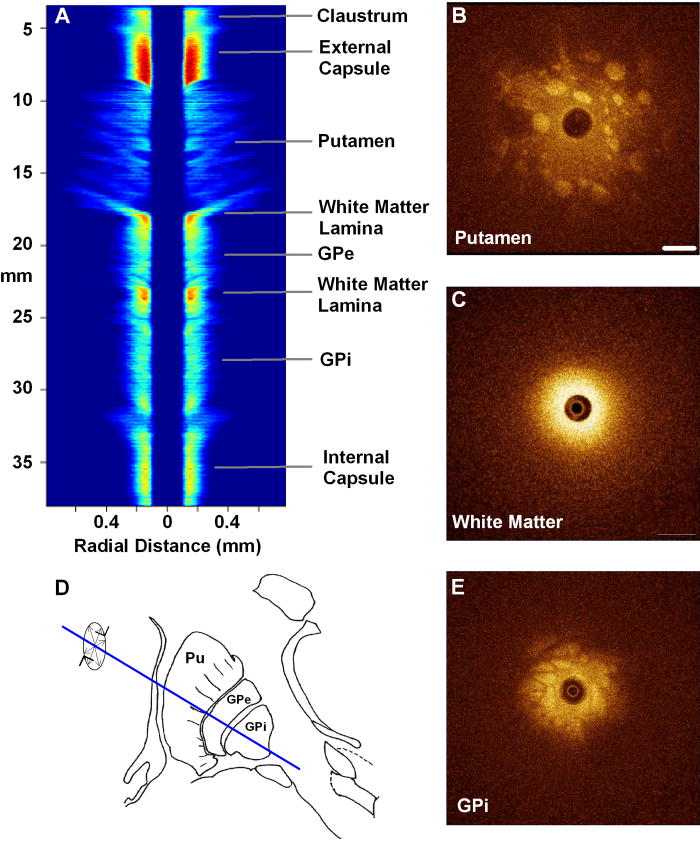 Figure 3 shows OCT images of the same structures of a comparable brain slice that were recorded as the probe advanced through the tissue. Myelinated fiber tracts typically appear bright in OCT images [Fig. 3(c)]. Their bright appearance on OCT demonstrates that myelinated fibers are also strong backscatterers of light in the near-IR spectrum . Penetration of light into the myelinated fibers is shallow (less than a few hundred micrometers). Dense myelinated fiber bundles can also create shadows that radiate away from the center, as illustrated in Fig. 3(b). Depending on their orientation with respect to the incident light, myelinated fibers may appear to have differing levels of brightness on OCT. Healthy white matter behaves predominately as a specular reflector. Indeed, if the fibers are oriented at a shallow angle relative to the incident OCT illumination, they can appear completely black since nearly all of the light is deflected rather than backscattered. The differences in the orientation of the myelinated fibers is the explanation of the apparent differences in brightness of similarly dense fiber bundles in Fig. 3(a). Information acquired by OCT for the purposes of DBS can be displayed in two basic formats. The most straightforward format is a sequence of 2-D tomograms [Figs. 3(b), 3(c), 3(e)]. In this format the characteristic distribution of gray-white matter, the blood vessel pattern, and the degree of light backscattering of each structure together provide an optical signature of the structure. Alternately, the intensity of the averaged backscattered light can be quantified and color coded to create a modified version of a longitudinal-mode (“L-mode”) display, which is commonly employed in intravascular ultrasound imaging. In Figs. 3(a), 4(a) color-coded light intensity is displayed as a function of radial distance and axial position as the probe is advanced in one direction. To obtain the L-mode images in these figures, the radially integrated intensity above a certain threshold (80% of maximum) was displayed on a color scale. This mode is particularly helpful for precisely mapping the position of gray-white matter borders and the position of the probe relative to these borders. Because intermittent electrical stimulation of the globus pallidus interna (GPi) can alleviate certain symptoms of Parkinson’s disease and dystonias, an OCT imaging sequence targeting the GPi was obtained (Fig. 3). The trajectory that was taken is illustrated in Figs. 2, 3(d). After going through the cortex and its subcortical gray, the probe reached the first prominent landmark along this track: the external capsule, a dense white-matter structure that surrounds the putamen. The transition from the external capsule to the putamen is sharp in the L-mode OCT display [Fig. 3(a)], reflecting the actual sharp boundary between these two structures (Fig. 2). By the midportion of the putamen, the diffusely distributed myelinated fibers start to coalesce into visible bundles that give rise to the striations after which the striatum is named. These striations appear as multiple bright, oval-shaped dots in the OCT tomograms [Fig. 3(b)]. As the OCT probe is advanced further toward the globus pallidus, the striations and dots on OCT become progressively larger. Immediately before reaching the globus pallidus, fiber tracts oriented perpendicular to the previously noted bundles appear and merge to form the putamen-globus pallidus lamina. This thin lamina is apparent on the L-mode display [Fig. 3(a)]. Further advancement of the probe brings it to the globus pallidus externa (GPe). The GPe and GPi have similar appearances on OCT. They appear as if they are composed of many closely packed white-matter bundles separated by thin layers of gray matter [Fig. 3(e)]. The GPe and GPi are separated by an additional white-matter lamina, the internal medullary lamina of the globus pallidus. This structure can be used as an important landmark for DBS of the GPi. Its position is apparent on the L-mode OCT display. In every case, the position of the probe within the brain slice, as identified by OCT, reliably matched the position illuminated by the visible targeting laser and recorded by the operator. These findings indicate that the putamen and globus pallidum can be reliably identified by their distinct optical signatures and that the distance to their borders can be precisely determined by catheter-based OCT. The subthalamic nucleus is another target for DBS. Currently, it is favored over the globus pallidus as the preferred target for DBS to manage Parkinson’s symptoms. To evaluate the feasibility of imaging the STN using OCT, the probe was advanced in a trajectory that grazed the lateral border of the thalamus, passed through the STN, and stopped within the substantia nigra. In Fig. 4(b), the OCT probe is shown on top of a coronal brain section through the STN to illustrate the general orientation of the imaging track. Positional information along the track through the STN can best be determined using OCT in the L-mode that color codes the absolute intensity of the backscattered light. Because the myelinated fibers are distributed more homogenously in the thalamus and STN, they do not form patterns in OCT images as unique as those associated with the putamen and globus pallidum. Between the thalamus and the STN are dense myelinated fiber tracts such as the thalamic fasciculus, lenticular fasciculus, and the subthalamic fasciculus; these myelinated fibers can be identified in the L-mode display [Fig. 4(a)]. Entrance into the STN is associated with a sudden decrease in the signal intensity without an increase in the depth of light penetration. The lack of an increase in light penetration was surprising, since entrance into gray matter is normally heralded by an increase in light penetration. Two relatively obscure neuroanatomic details about the STN provide reasonable explanations for its optical characteristics. First, the STN is a gray-matter nucleus with a high level of myelination that is uniformly distributed. This is evident in atlases of the human brain that use myelin stains. Second, the STN contains an unusually high blood content. Red blood cells are weak reflectors, yet strongly attenuate the OCT beam.15 The combination of a moderate level of myelination and high blood content renders the STN low in signal intensity, with a shallow depth of penetration on OCT. Scanning EM studies of vascular endocasts have demonstrated the presence of a dense plexus of fine capillaries at the region comparable to the STN in the human. This level of vascularity is not surprising, considering the fact that the small, closely packed neurons in the STN are autonomously active at rest and capable of sustained high-frequency activity. These metabolically active neurons may require an ample vascular supply. Consistent with this explanation is our observation that the STN appears darker and redder than any neighboring structure besides the red nucleus [Fig. 4(b)]. The current OCT system cannot resolve the fine individual capillaries that are less than in diameter. However, it can detect an unusually high density of 15- to vessels that probably represent the precapillary arterioles [Fig. 4(c)]. While there is no unique optical signature of the STN, the presence of these fine vessels in nearly every optical section through the STN may serve as a strong secondary evidence of being within the STN. Separating the STN from the substantia nigra is a thin white-matter capsule, the subthalamic fasciculus. This fasciculus can be precisely identified using OCT in the L-mode [Fig. 4(a)]. Immediately ventral to the subthalamic fasciculus is the substantia nigra (SN). Entrance into the SN is apparent on OCT. There is a marked increase in the depth of light penetration on entering the SN. The lateral aspect of the SN is associated with thick ribbons of white matter tracts [Fig. 4(d)], whereas the medial aspect of the SN has a lesser number of these ribbon-like bands. Interestingly and counterintuitively, the SN pars compacta, which is the darkest region in the brain under visible illumination, is associated with good light penetration in the near-IR spectral region used by OCT. To more directly demonstrate the feasibility of OCT-guided targeting, three passes were made through a 10-mm-thick brain slice containing the STN. The brain section was then partially frozen and sliced into 2- to 3-mm sections perpendicular to the electrode passes to reconstruct the 3-D shape of the STN and to identify the positions of the tracks left by the imaging probe. Each OCT sequence was matched to a track left in the tissue [Fig. 5(d) ]. Comparison of the OCT sequence with the reconstructed STN showed good correspondence between the length of the STN determined by OCT [Figs 5(a), 5(b), green box] and the actual distance through the STN. These results fail to convey the speed with which an OCT pass can be completed compared to current microelectrode recording methods. Because OCT is not faced with the sampling problem that confronts microelectrode recording, an accurate and reliable OCT pass can be completed in minutes rather than in hours. Fig. 5Lateral position of the probe track can be inferred from the length through the STN. (a) L-mode projection of OCT through lateral edge of STN (D, blue line). The thickness of the STN at this point is about 1 mm (green box). (b) L-mode projection through center of STN (D, red line). The thickness of the STN along this trajectory is about 5 mm (green box). (c) L-mode projection along a trajectory that misses the STN and passes through only white matter (D, green line). (d) Drawing of 1-mm-thick slices of STN showing trajectories of three passes shown in (a) to (c). 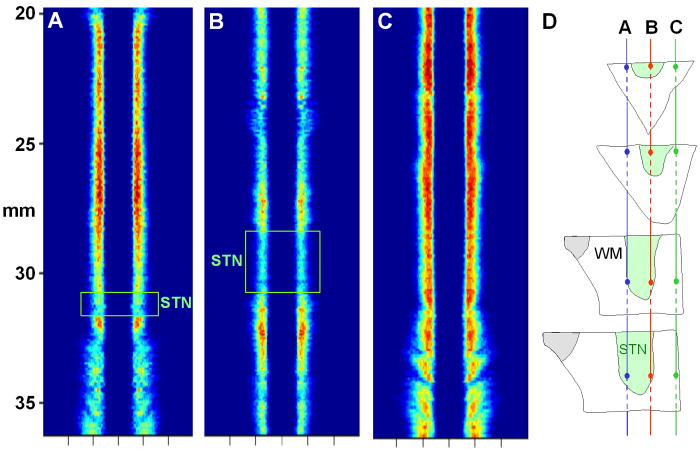 The most feared complication of DBS is intraparenchymal hemorrhage caused by laceration of a blood vessel with blind placement of the DBS electrode. Can catheter-based OCT be employed to prevent such complications? OCT is highly sensitive for detecting blood vessels because the black appearance of blood stands out prominently against the background. Figure 6(a) illustrates a large vessel in the putamen comparable to that shown in Fig. 1(b) (thick arrow). The reflective walls of the vessel are also evident. It is possible to perform a 3-D reconstruction of the vessel from a sequence of 2-D OCT images [Fig. 6(c)]. Fig. 6Three-dimensional reconstruction of blood vessel in human putamen: (a) image of lateral putamen shows large blood vessel (dark band) and small white matter tracts (bright dots), (b) small blood vessels (dark areas) are common in STN, and (c) 3-D reconstruction of blood vessel (red) and white matter tracts (green) from a series of images taken before and after the image in (a). Scale bar, 0.5 mm.  Reasoning that vacuoles potentially have high intrinsic optical contrast and that their dimensions in human spongiform encephalopathies are within the spatial resolution of OCT, we examined the brain from a patient who had died of CJD. The patient was a 53-year-old female who presented with a rapidly progressive dementing disease. Her neurological exam was suggestive of CJD with prominent myoclonus. Extensive studies with MRI, lumbar puncture, electroencephalography (EEG), and blood tests did not reveal any other known disorders. Following her death, the patient’s brain underwent gross and microscopic examination that showed classic spongiform changes. Tissue samples were strongly positive for the presence of prion protein amyloid by Western immunoblot assay.16 The distribution of prion amyloid in this brain was reported as patient 1 in Brown 17 Immediately following the autopsy, coronal sections of the brain were rapidly frozen on dry ice and subsequently stored at . For this study, a piece of the temporal lobe was slowly thawed in ice water and the OCT imaging probe was advanced into the parahippocampal gyrus and the hippocampus. Figure 7(a) illustrates representative images from OCT video sequences showing numerous vacuoles in the parahippocampal gyrus. On OCT, the vacuoles appear as round dark circles often with a bright reflection on the front or back surface. The vacuoles also create penumbra-like shadows due to refraction by the vacuole. The vacuoles that could be clearly detected ranged in size between 30 and . The 65-nm bandwidth of the light source and the limited lateral resolution of the current OCT system are significant impediments to the detection of smaller vacuoles. Vacuoles were not detected in the hippocampus proper [Fig. 7(b)]. This site-specific differential distribution of spongiform lesion is typical of CJD and was noted in the autopsy report of this patient. This observation argues against freeze artifacts that can sometimes be confused with true spongiform lesions. Other observations supporting this point include the absence of vacuoles in the 25 frozen brains used for the OCT study of optical guidance in DBS, widespread spongiform changes noted by histology at the time of autopsy before the brain was frozen, and the observation of almost identical vacuoles in OCT images of hamster brains infected with scrapie immediately following sacrifice (data not shown). Scrapie is a spongiform encephalopathy similar to CJD. The limited resolution of our current OCT system does not yet enable us to detect the spongiform change in the hamster model of scrapie with high sensitivity. It is also not yet known whether OCT will be able to detect the spongiform changes associated with Mad Cow disease (BSE). The impending introduction of wide-bandwidth light sources for ultra-high-resolution OCT, however, offers the promise that OCT may soon be able to image these lesions with high sensitivity.10, 18 Fig. 7(a) OCT image of human parahippocampal gyrus from autopsy brain of a CJD patient shows vacuoles characteristic of the spongiform disease. Vacuoles appear as dark circles casting shadows away from the probe, sometimes with bright reflections along the front and rear surfaces. (b) Region along the same track lacking vacuoles. Scale bar, 0.4 mm.  4.ConclusionCurrently, OCT is used widely only in the field of ophthalmology. Bringing this emerging imaging technology from the bench to the bedside in more clinical applications is a challenge for those involved with translational research. For clinical neuroscience, the difficulty has been identifying structures with high intrinsic optical contrast for OCT. Evidence is provided to show that the gray matter–white matter junction is one structure that OCT can detect with high contrast and that can serve as a landmark for guiding DBS procedures. Evidence is also provided to show that vacuoles in spongiform encephalopathies are other structures that OCT can detect with high contrast. A second challenge of translation research is to identify applications with societal impact. Utilization of OCT to improve the management of Parkinson’s disease would satisfy this criterion. Similarly, if OCT could be developed as a rapid in vivo or ex vivo screening test for Mad Cow disease to complement slower biochemical assays, the financial impact on the economies of the United States alone could be significant. It may also be possible to develop catheter-based OCT as a far-preferable alternative to brain biopsy for the conclusive in vivo diagnosis of the human TSE diseases. AcknowledgmentsHuman tissue was obtained from the National Institute of Child Health and Human Development (NICHD) Brain and Tissue Bank for Developmental Disorders under contracts NO1-HD-4-3368 and NO1-HD-4-3383. We would like to thank Dr. H. Ronald Zilke, Robert D. Vigorito, and Robert M. Johnson from the Brain and Tissue Bank for their assistance in obtaining the human brain tissue. This material is based on work supported in part by the Office of Research and Development, Medical Research Service, Department of Veterans’ Affairs VA REAP Award (P.S.F (PI), M.S.J., C.-M.T.); VA Merit Review (C.-M.T.); and VA Merit Review (R.G.R). Funding was also provided by U.S. National Institutes of Health Grants R01-NS044627 (C.-M.T.); R01-EB004057 (C.-M.T.); N01-NS02327 (R.G.R.); and R01-HL63930 (R.G.R.) and U.S. Department of Defense Grant DAMD-17-03-1-0756 (R.G.R.). ReferencesDeep Brain Stimulation for Parkinson’s Disease Study group,
“Deep-brain stimulation of the subthalamic nucleus or the pars interna of the globus pallidus in Parkinson’s disease,”
N. Engl. J. Med., 345 956
–963
(2001). 0028-4793 Google Scholar
P. Limousin,
P. Krack,
P. Pollak,
A. Benazzouz,
C. Ardouin,
D. Hoffmann, and
A. L. Benabid,
“Electrical stimulation of the subthalamic nucleus in advanced Parkinson’s disease,”
N. Engl. J. Med., 339 1105
–1111
(1998). 0028-4793 Google Scholar
P. A. Starr,
“Placement of deep brain stimulators into the subthalamic nucleus or Globus pallidus internus: Technical approach,”
Stereotact. Funct. Neurosurg., 79 118
–145
(2002). 1011-6125 Google Scholar
J. G. Fujimoto,
M. E. Brezinski,
G. J. Tearney,
S. A. Boppart,
B. Bouma,
M. R. Hee,
J. F. Southern, and
E. A. Swanson,
“Optical biopsy and imaging using optical coherence tomography,”
Nat. Med., 1 970
–972
(1995). 1078-8956 Google Scholar
D. Huang,
E. A. Swanson,
C. P. Lin,
J. S. Schuman,
W. G. Stinson,
W. Chang,
M. R. Hee,
T. Flotte,
K. Gregory,
C. A. Puliafito, and
J. G. Fujimoto,
“Optical coherence tomography,”
Science, 254 1178
–1181
(1991). 0036-8075 Google Scholar
S. J. DeArmond and
S. B. Prusiner,
“Perspectives on prion biology, prion disease pathogenesis, and pharmacologic approaches to treatment,”
Clin. Lab Med., 23 1
–41
(2003). 0272-2712 Google Scholar
B. Chesebro,
“Introduction to the transmissible spongiform encephalopathies or prion diseases,”
Br. Med. Bull., 66 1
–20
(2003). 0007-1420 Google Scholar
S. J. DeArmond and
S. B. Prusiner,
“Prion disease,”
Greenfield Neuropathol., 6 235
–280
(1997). Google Scholar
D. A. Hilton,
A. C. Ghani,
L. Conyers,
P. Edwards,
L. McCardle,
D. Ritchie,
M. Penney,
D. Hegazy, and
J. W. Ironside,
“Prevalence of lymphoreticular prion protein accumulation in UK tissue samples,”
J. Pathol., 203 733
–739
(2004). 0022-3417 Google Scholar
K. Bizheva,
A. Unterhuber,
B. Hermann,
B. Povazay,
H. Sattmann,
W. Drexler,
A. Stingl,
T. Le,
M. Mei,
R. Holzwarth,
H. A. Reitsamer,
J. E. Morgan, and
A. Cowey,
“Imaging ex vivo and in vitro brain morphology in animal models with ultrahigh resolution optical coherence tomography,”
J. Biomed. Opt., 9 719
–724
(2004). https://doi.org/10.1117/1.1756920 1083-3668 Google Scholar
S. A. Boppart,
M. E. Brezinski,
C. Pitris, and
J. G. Fujimoto,
“Optical coherence tomography for neurosurgical imaging of human intracortical melanoma,”
Neurosurgery, 43 834
–841
(1998). 0148-396X Google Scholar
S. Roper,
M. D. Morgner,
G. V. Gelikonov,
F. I. Feldchtein,
N. M. Beach,
M. A. King,
V. M. Gelikonov,
A. M. Sergeev, and
D. H. Reitze,
“In-vivo detection of experimentally induced cortical dygenesys abnormality in the adult rat neocortex using optical coherence tomography,”
J. Neurosci. Methods, 80 91
–98
(1998). https://doi.org/10.1016/S0165-0270(97)00202-1 0165-0270 Google Scholar
R. Uma Maheswari,
H. Takaoka,
R. Homma,
H. Kadono, and
M. Tanifuji,
“Implementation of optical coherence tomography (OCT) in visualization of functional structures of cat visual cortex,”
Opt. Commun., 202 47
–54
(2002). https://doi.org/10.1016/S0030-4018(02)01079-9 0030-4018 Google Scholar
E. A. Swanson,
C. L. Peterson,
E. McNamara,
R. B. Lamport, and
D. L. Kelly,
“Ultra-small optical fiber probes and imaging optics,”
(1999). Google Scholar
A. N. Yaroslavsky,
I. V. Yaroslavsky,
T. Goldbach, and
J.-H. Schwarzmaier,
“Optical diagnostics of living cells and biofluids,”
Proc. SPIE, 2678 314
–324
(1996). 0277-786X Google Scholar
R. G. Rohwer and
S. Harris, Google Scholar
P. Brown,
K. Kenney,
B. Little,
J. Ironside,
R. Will,
L. Cervenakova,
R. J. Bjork,
R. A.San Martin,
J. Safar, and
R. Roos,
“Intracerebral distribution of infectious amyloid protein in spongiform encephalopathy,”
Ann. Neurol., 38 245
–253
(1995). 0364-5134 Google Scholar
W. Drexler,
U. Morgner,
R. K. Ghanta,
F. X. Kartner,
J. S. Schuman, and
J. G. Fujimoto,
“Ultrahigh-resolution ophthalmic optical coherence tomography,”
Nat. Med., 7 502
–507
(2001). 1078-8956 Google Scholar
|


